-
Archives
- May 2017
- April 2017
- March 2017
- February 2017
- January 2017
- December 2016
- November 2016
- October 2016
- September 2016
- August 2016
- May 2016
- April 2016
- March 2016
- February 2016
- January 2016
- December 2015
- November 2015
- October 2015
- September 2015
- August 2015
- July 2015
- May 2015
- April 2015
- March 2015
- February 2015
- January 2015
- December 2014
- November 2014
- October 2014
- September 2014
- August 2014
- May 2014
- April 2014
- February 2014
- January 2014
- December 2013
- November 2013
- August 2013
- April 2013
- March 2013
- February 2013
- January 2013
-
Meta
Category Archives: Class News
Video Assignments for 9/11
Video 1 – Click here to view the Camouflage and Color Video
Video 2 – Click here to view the Symbiosis in the Sea Video
Posted in Class News
Leave a comment
HW for 9/10
Period 6 – Complete Chicken Growth and Population Study Reflection (paragraph and illustration)
Period 4 – NONE
Posted in Class News
Leave a comment
HW for 9/8-9
Using any resource, find 10 examples of capillary action in nature or in everyday life and write it in your capillary action SEEI example box in your notebook.
Posted in Class News
Leave a comment
Kauaiʻs Wild Chickens
Click here to read about Kauaiʻs Wild Chicken population. After reading the article, on binder paper, make a list of the whatʻs GOOD about Kauaiʻs wild chickens, a list of whatʻs BAD about Kauaiʻs wild chickens and whatʻs UGLY about Kauaiʻs wild chickens.
Posted in Class News
Leave a comment
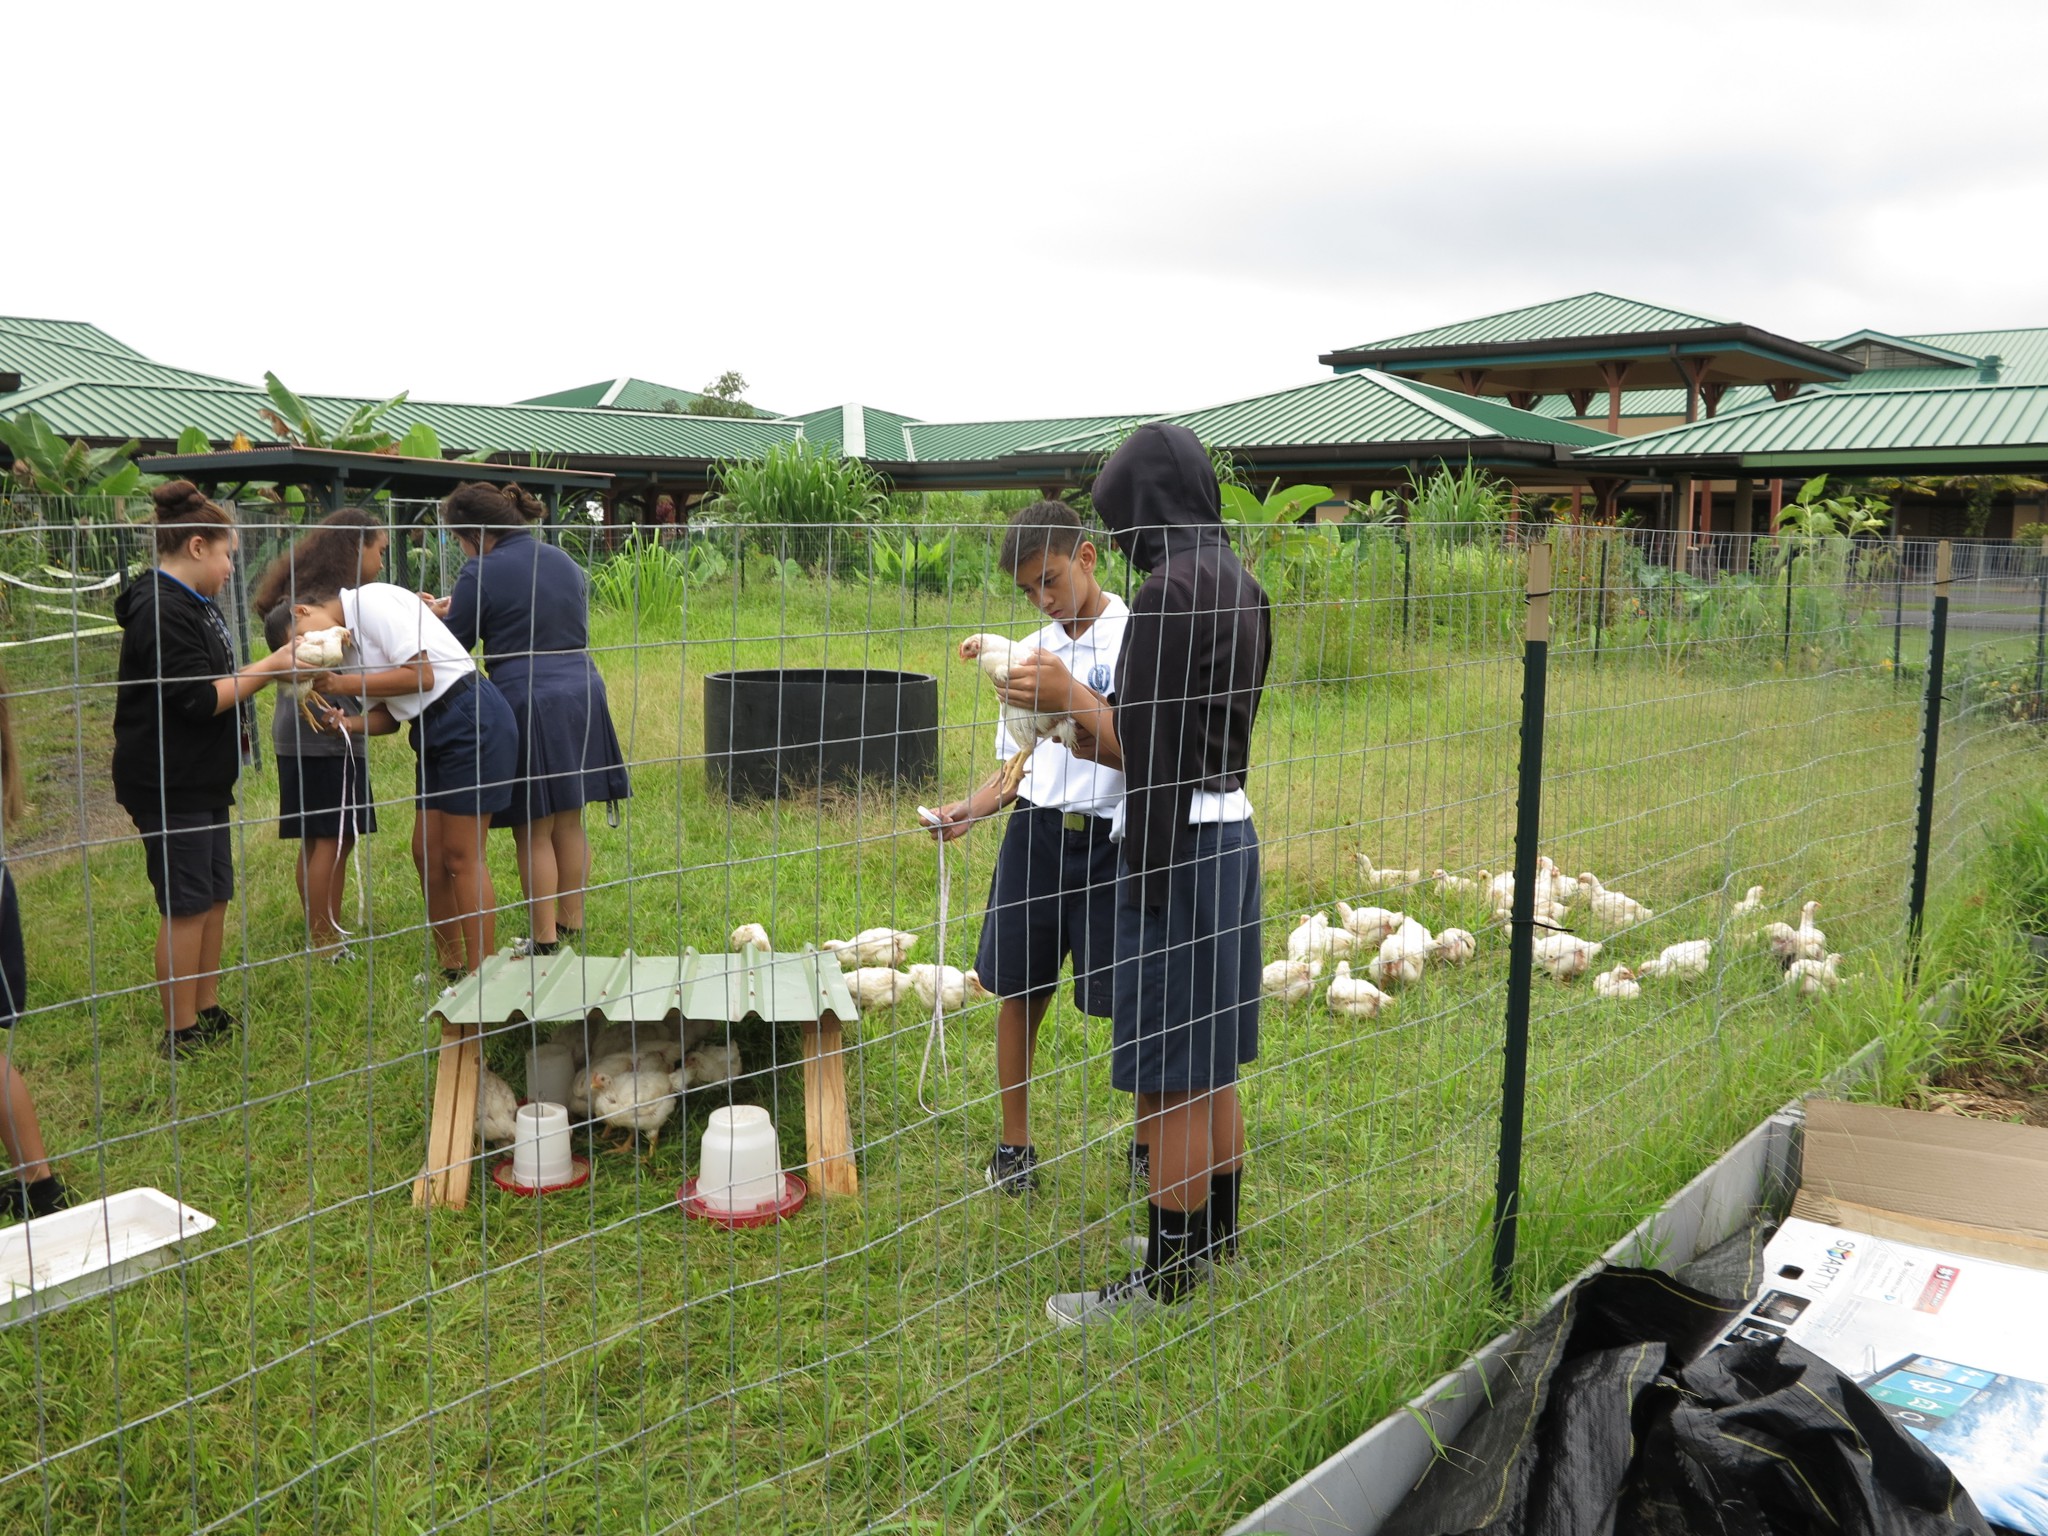
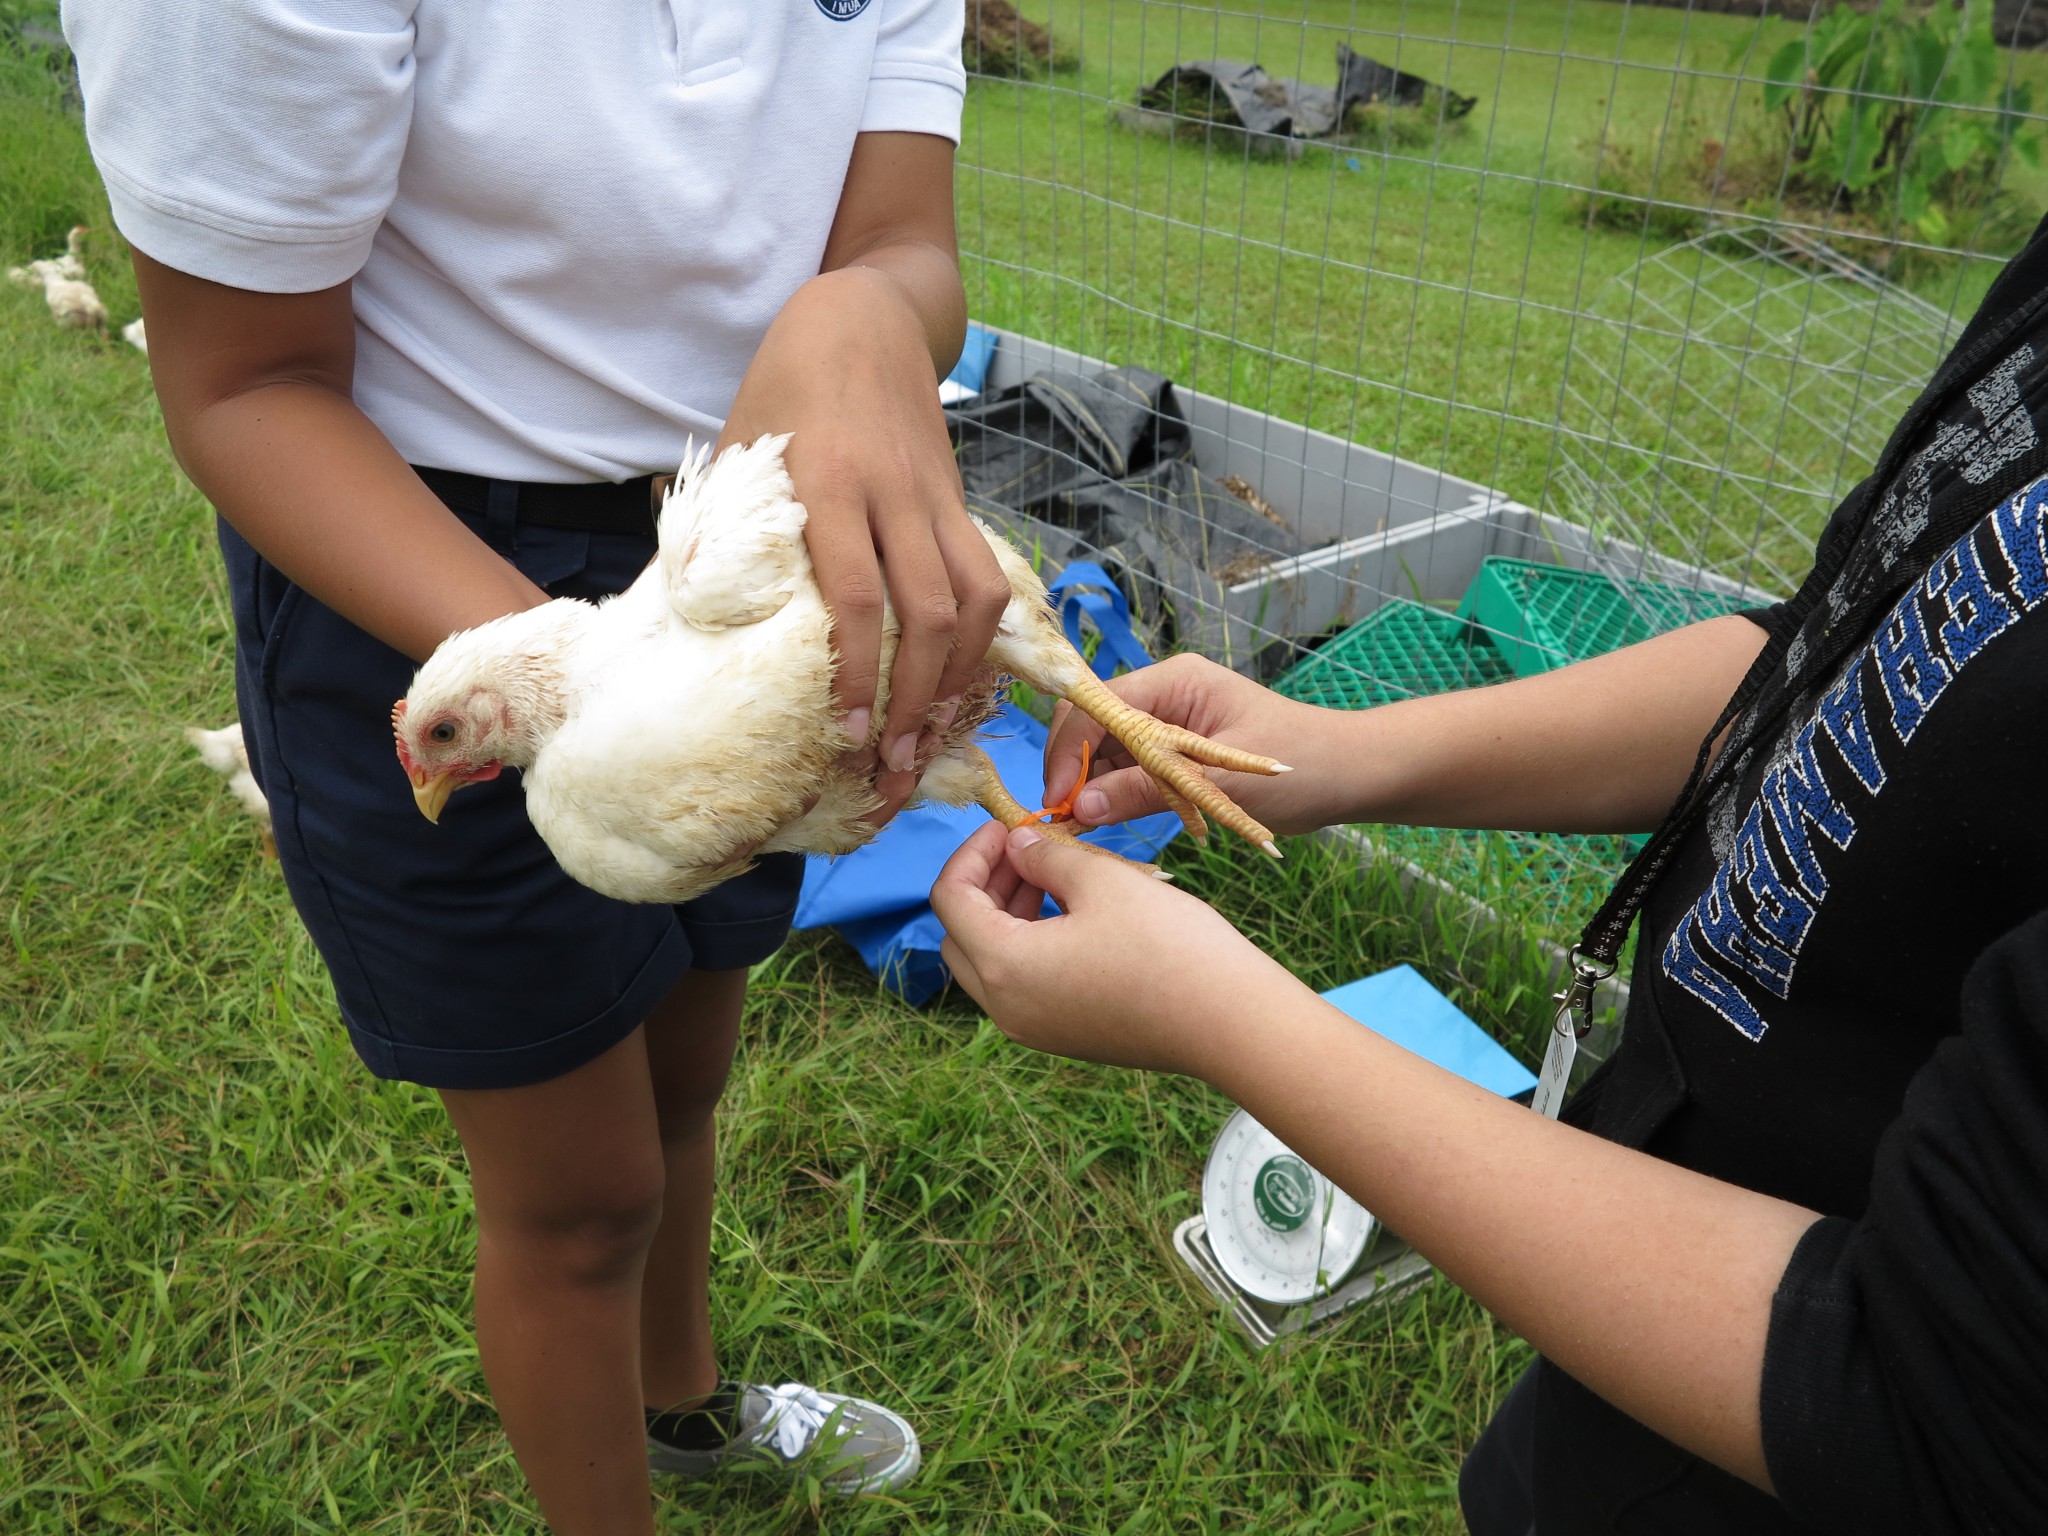
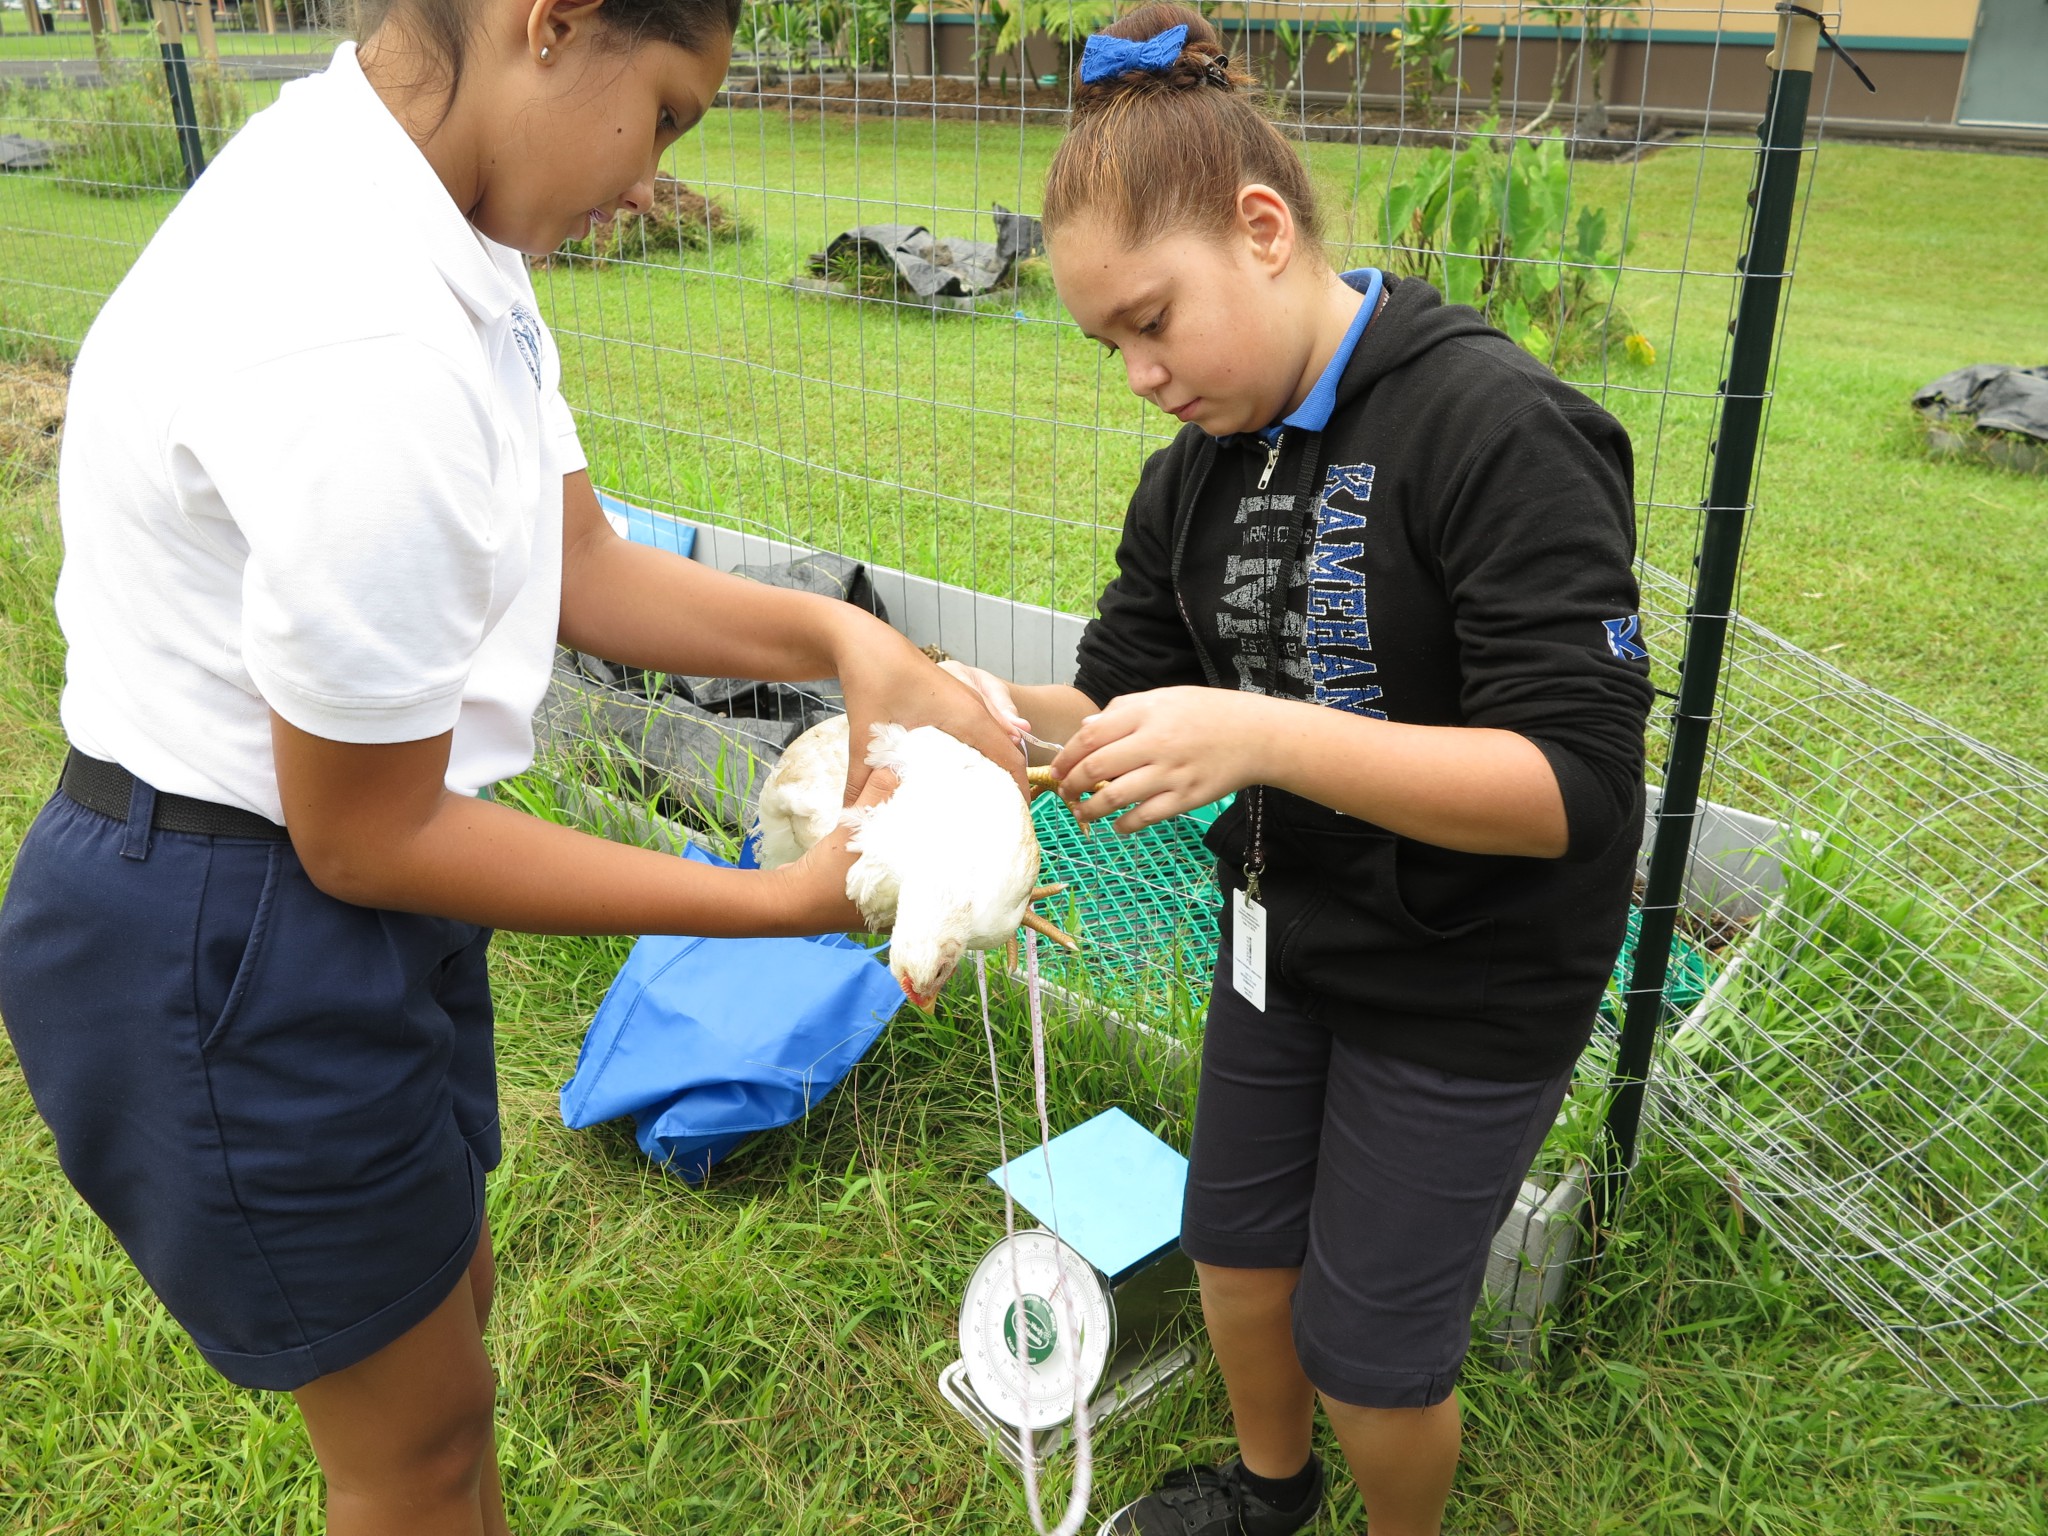
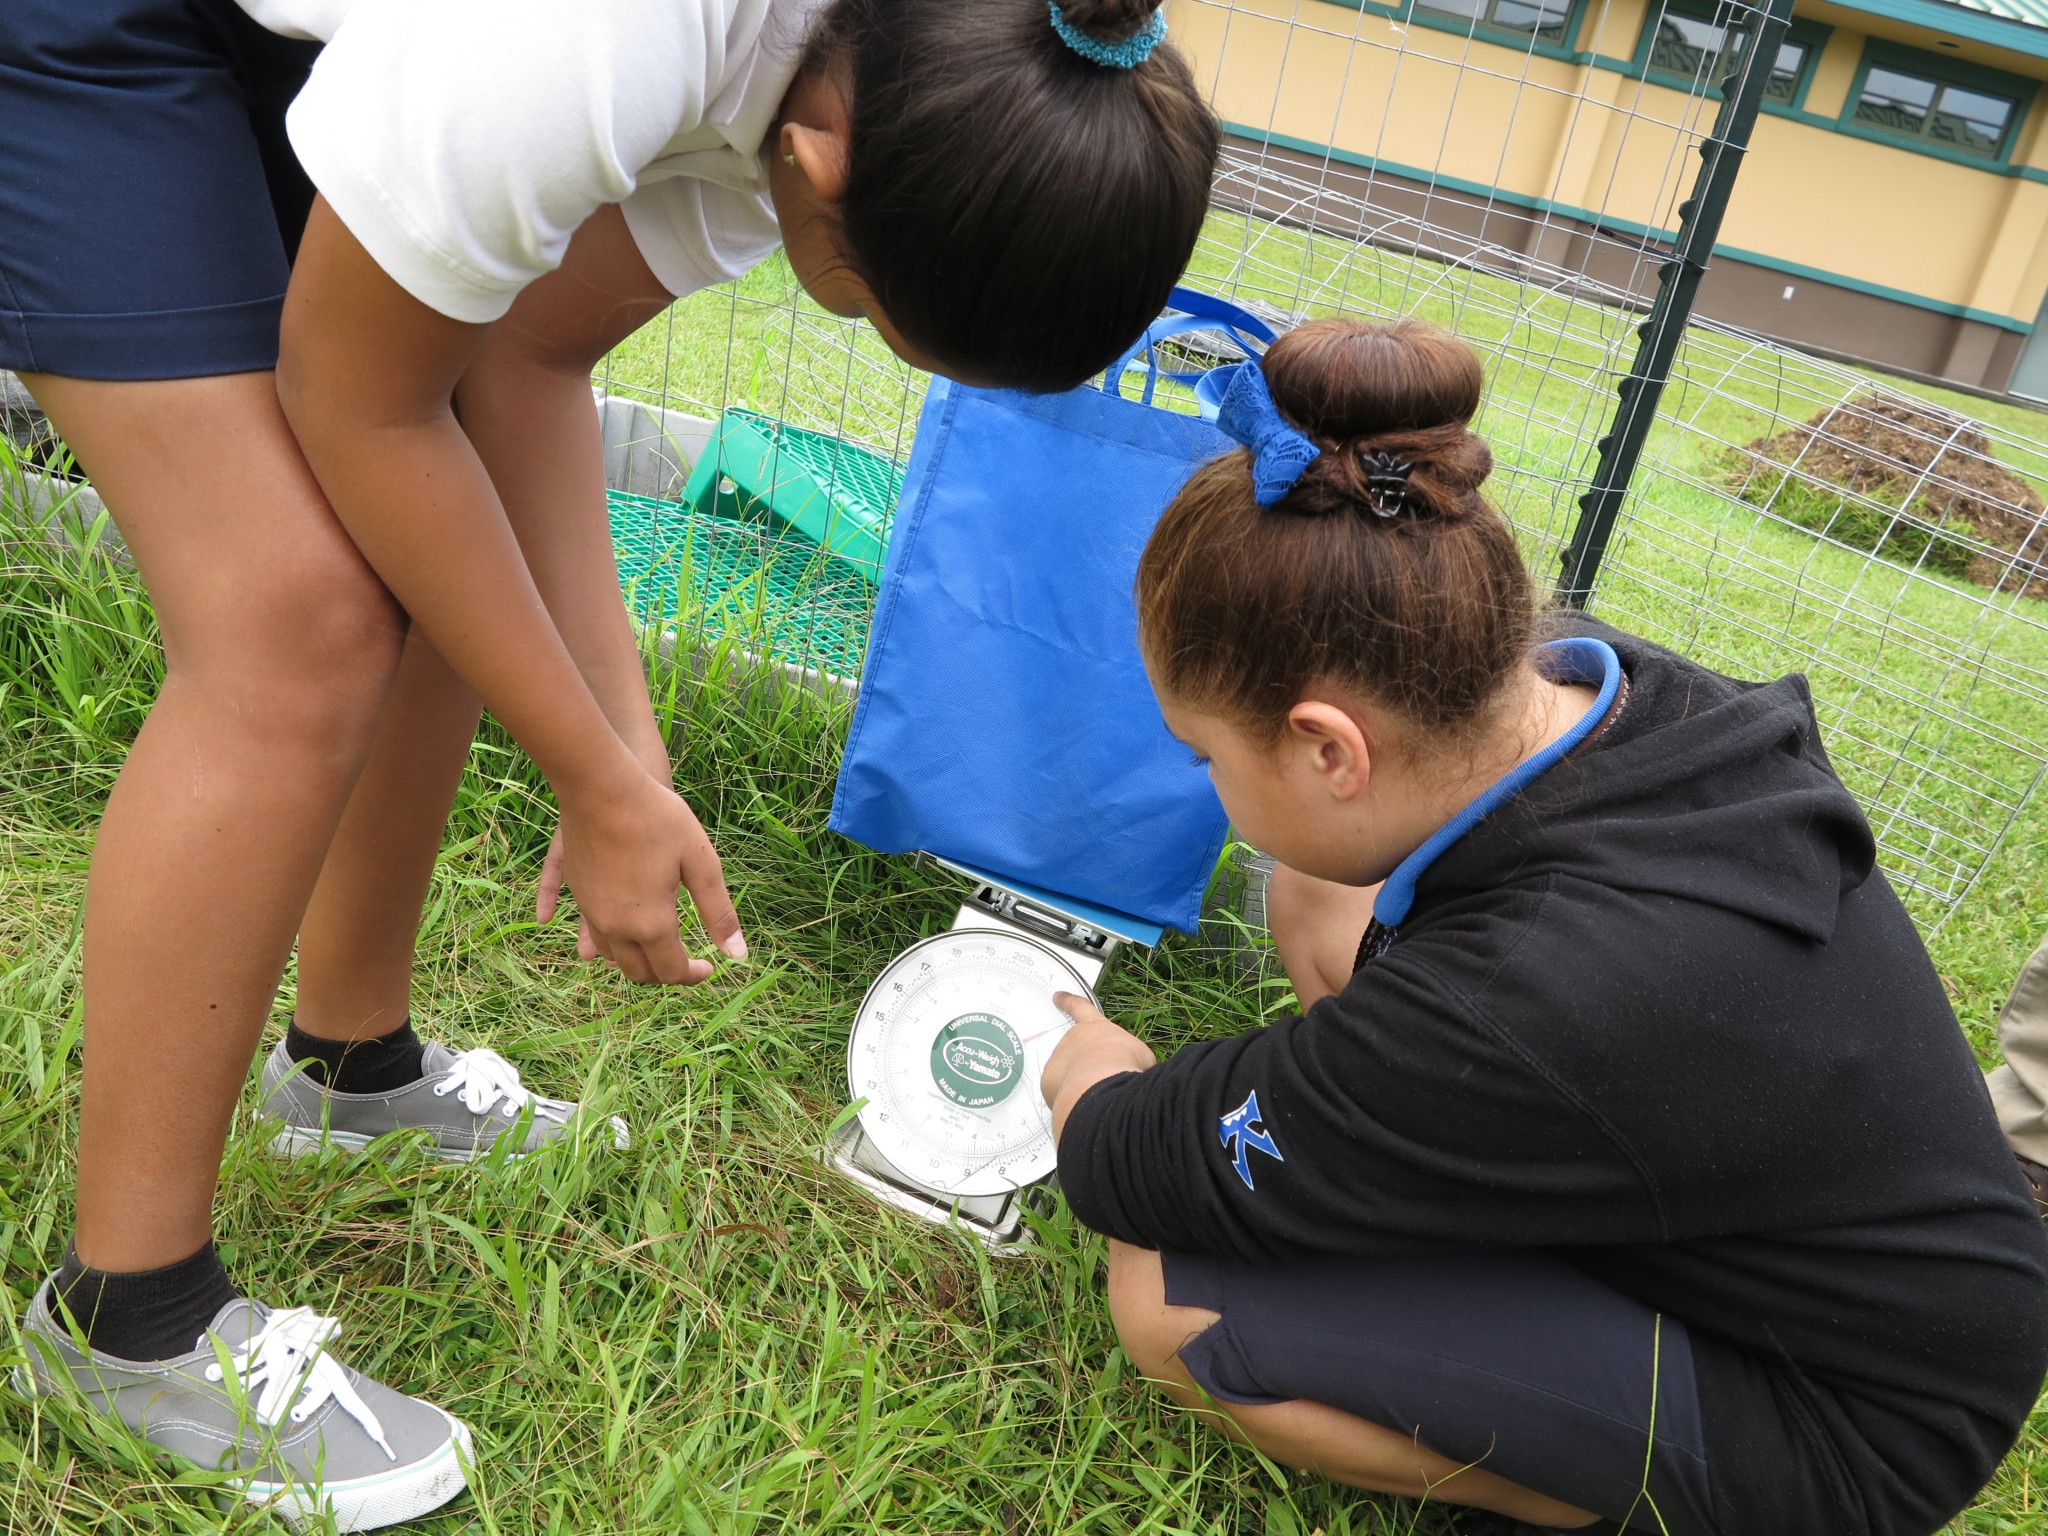
Got Chickens?
Period 5 tagged and measured weight, wing chord and tarsus as part of a chicken growth and population study.
Posted in Class News
Leave a comment
HW for 9/3-4
In Google Classroom Complete: 1. Typing of all information into WDE Report, 2. Type WDE Conclusion Paragraph, 3. WDE Line Graph – submit to Google Classroom when complete. Due Date: 9/8 (evens), 9/9 (odds).
Posted in Class News
Leave a comment
Whatʻs Happening in Science?
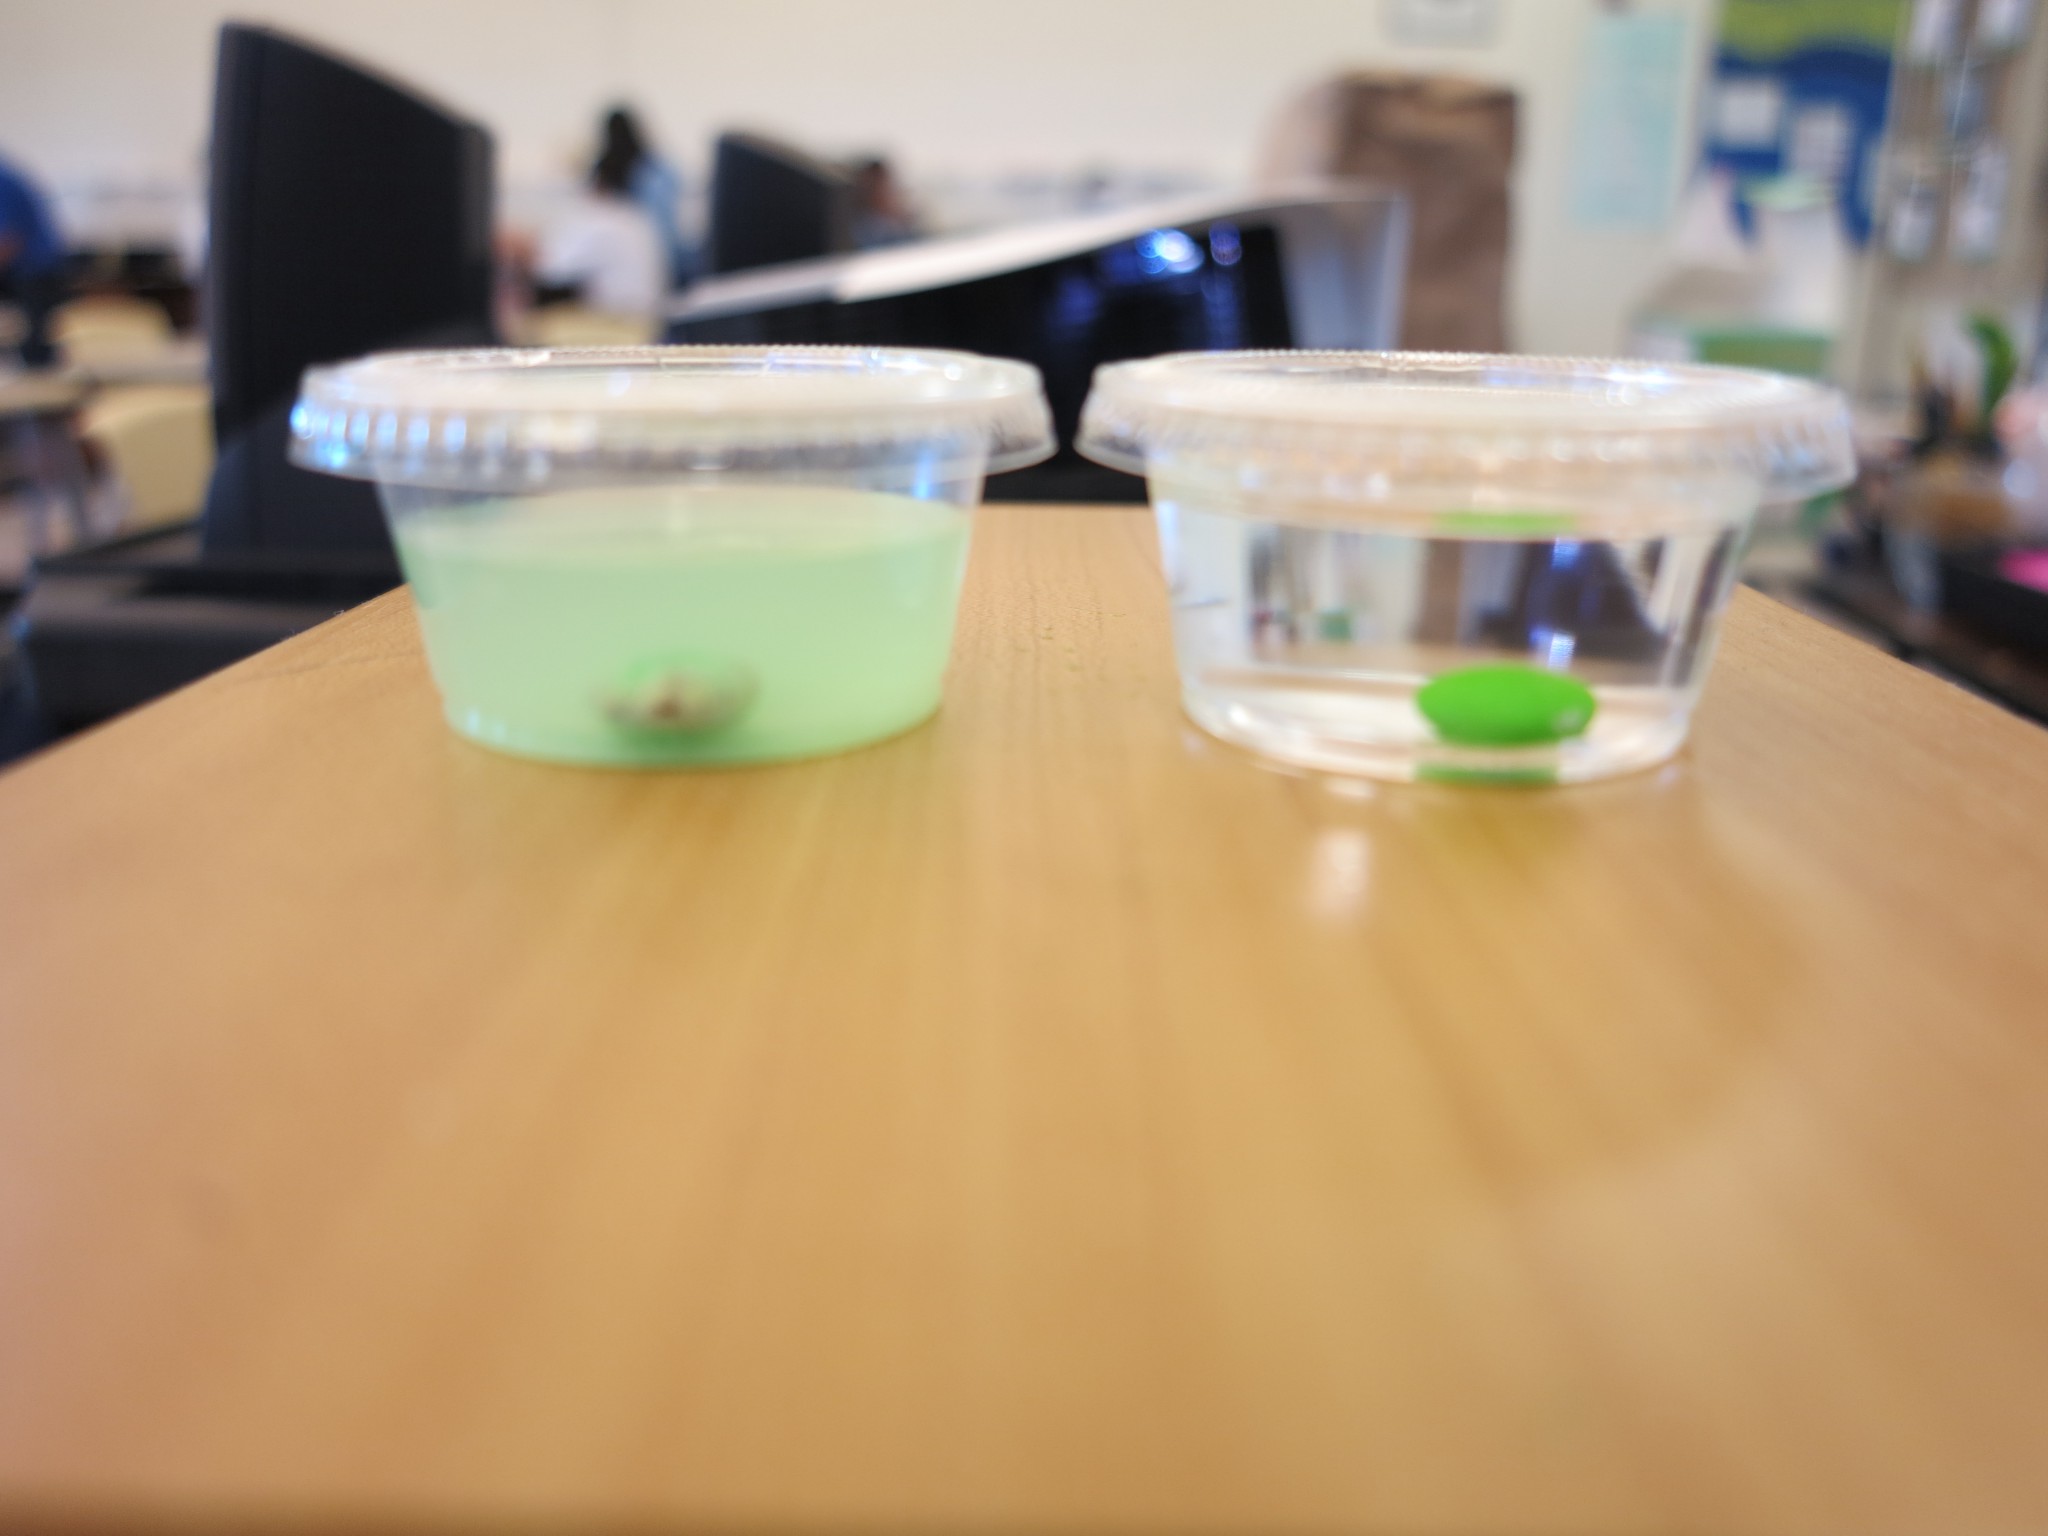
POLAR OR NONPOLAR???????????????
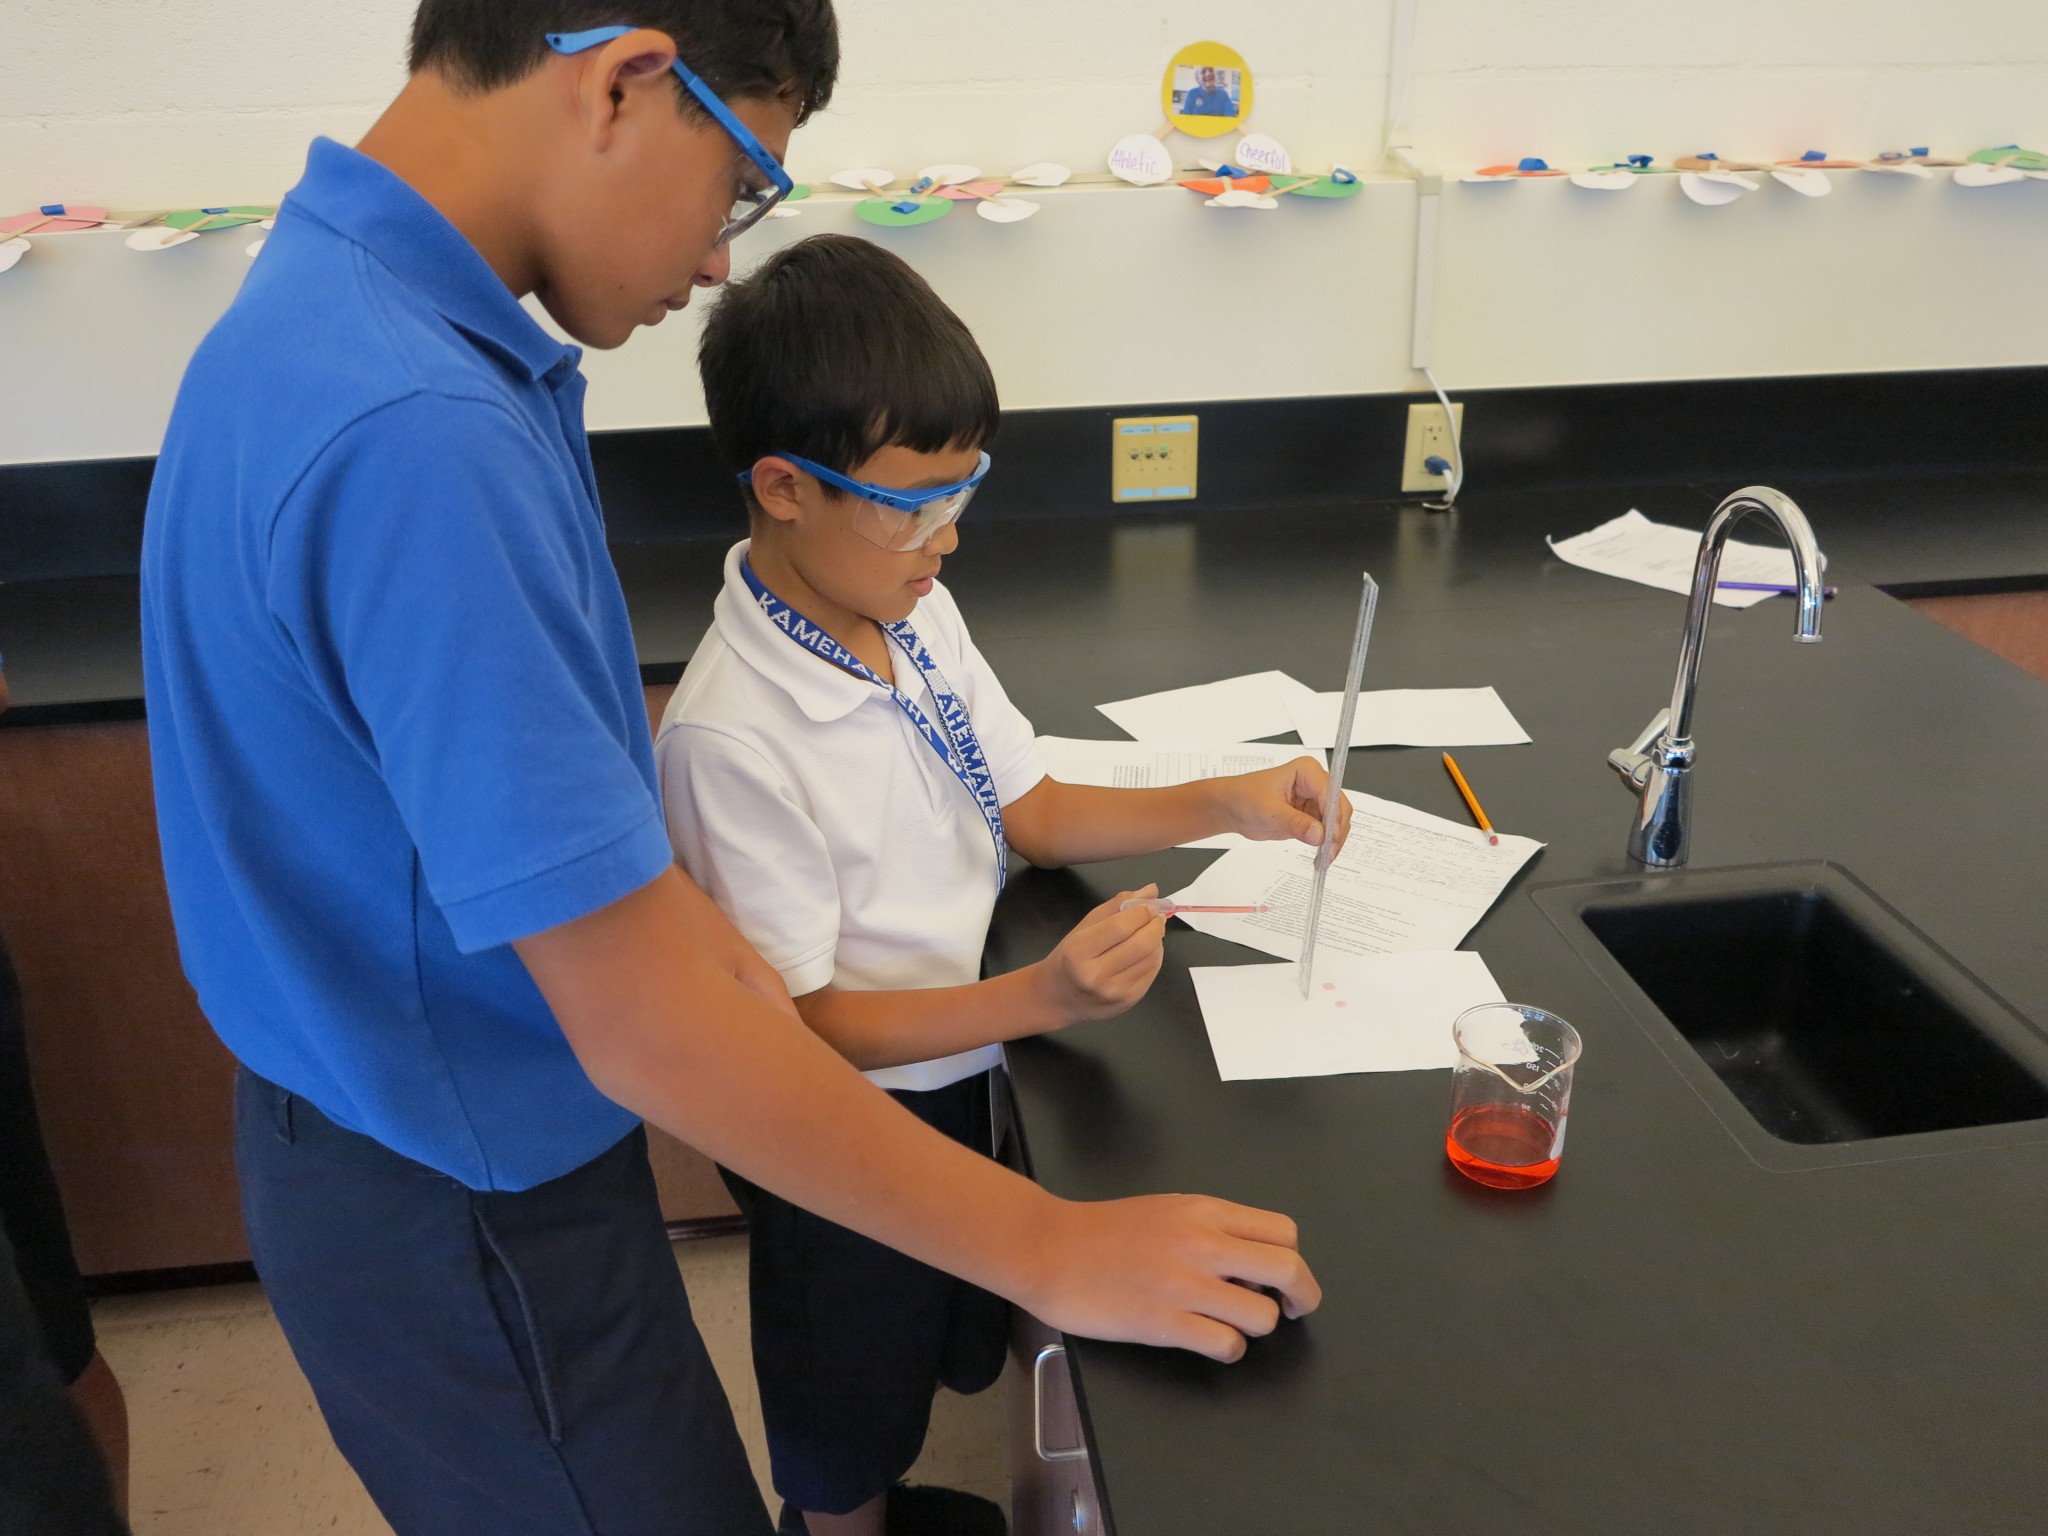
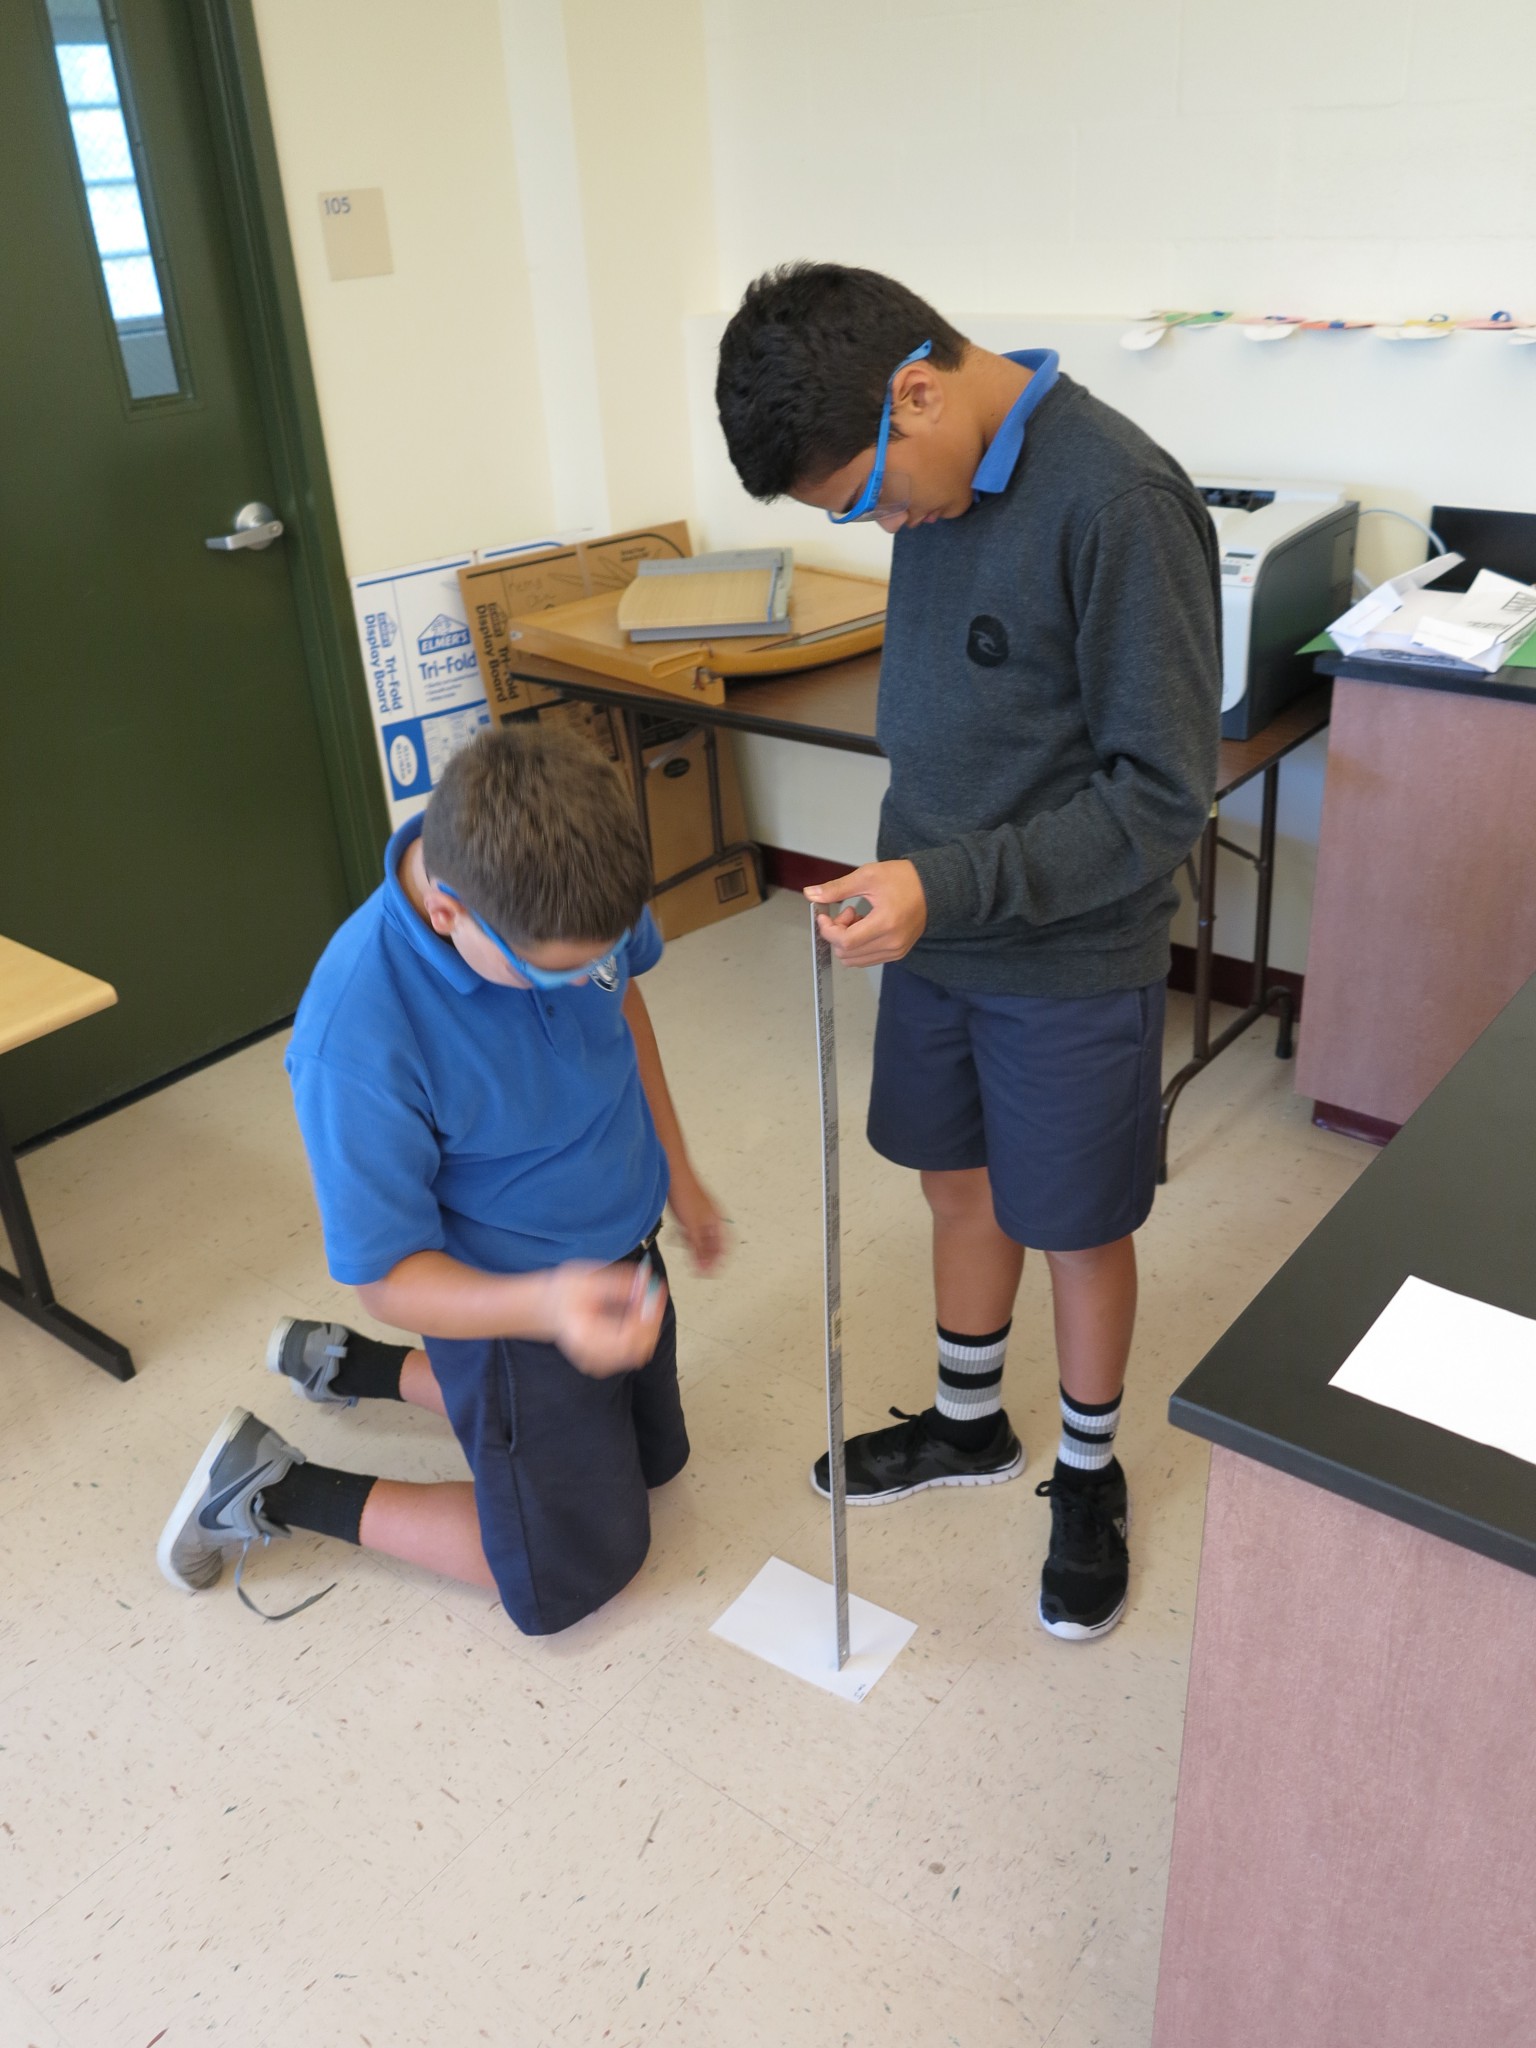
WATER DROP EXPERIMENT – Investigating SURFACE TENSION
Posted in Class News
Leave a comment
HW for 9/1-2
- In Google Classroom, open the Water Drop Experiment Lab Report. Transfer (type) all written information on worksheet into the document.
- In Google Classroom, open the WDE Line Graph Assignment sheet. Make a line graph of your data. See directions below or directions are given in the Water Drop Experiment Lab Report.
- LINE GRAPH – Look in your Google Classroom for the WDE Line Graph Sheet. Open it and type in your Drop Height and Average Splatter Size (numbers only). Then HIGHLIGHT all cells that you typed in (include the column titles). Go to INSERT at top menu and scroll down to CHART. In the CHART EDITOR, click on CHART TYPES, then click on LINE on far left. Above the LINE, place a check in the Use row 1 as headers and Use column A as labels. Your line graph should show up. Now go to the CUSTOMIZATION menu at the top of the CHART EDITOR. Give the graph an appropriate title. Scroll down to Axis (Horizontal) and type in a title for the numbers on you horizontal axis. Change the horizontal to LEFT VERTICAL and type a title for the numbers on the vertical axis.
Posted in Class News
Leave a comment