How much trash do you waste?
A few weeks ago the second graders started their unit on recycling. We read some books and watched a few video clips and had many discussions that lead to questions. In one of our video clips it had mentioned that each person usually throws out about 1,000 pounds of trash a year. Astonished, the second graders decided to conduct their own experiment to see if that would be possible and maybe compare that average to themselves.
Two weeks ago the second graders embarked on that experiment to collect all their trash from the time they reach school to the time they leave. Each student was given a ziplock back to collected with trash. Anything that they would have normally threw away in the trash can was to go into the ziplock. Due to health and safety issues, no used paper towels, kleenex, napkins or food products were collected. However, if they did use those items they were to tally it on the ziplock.
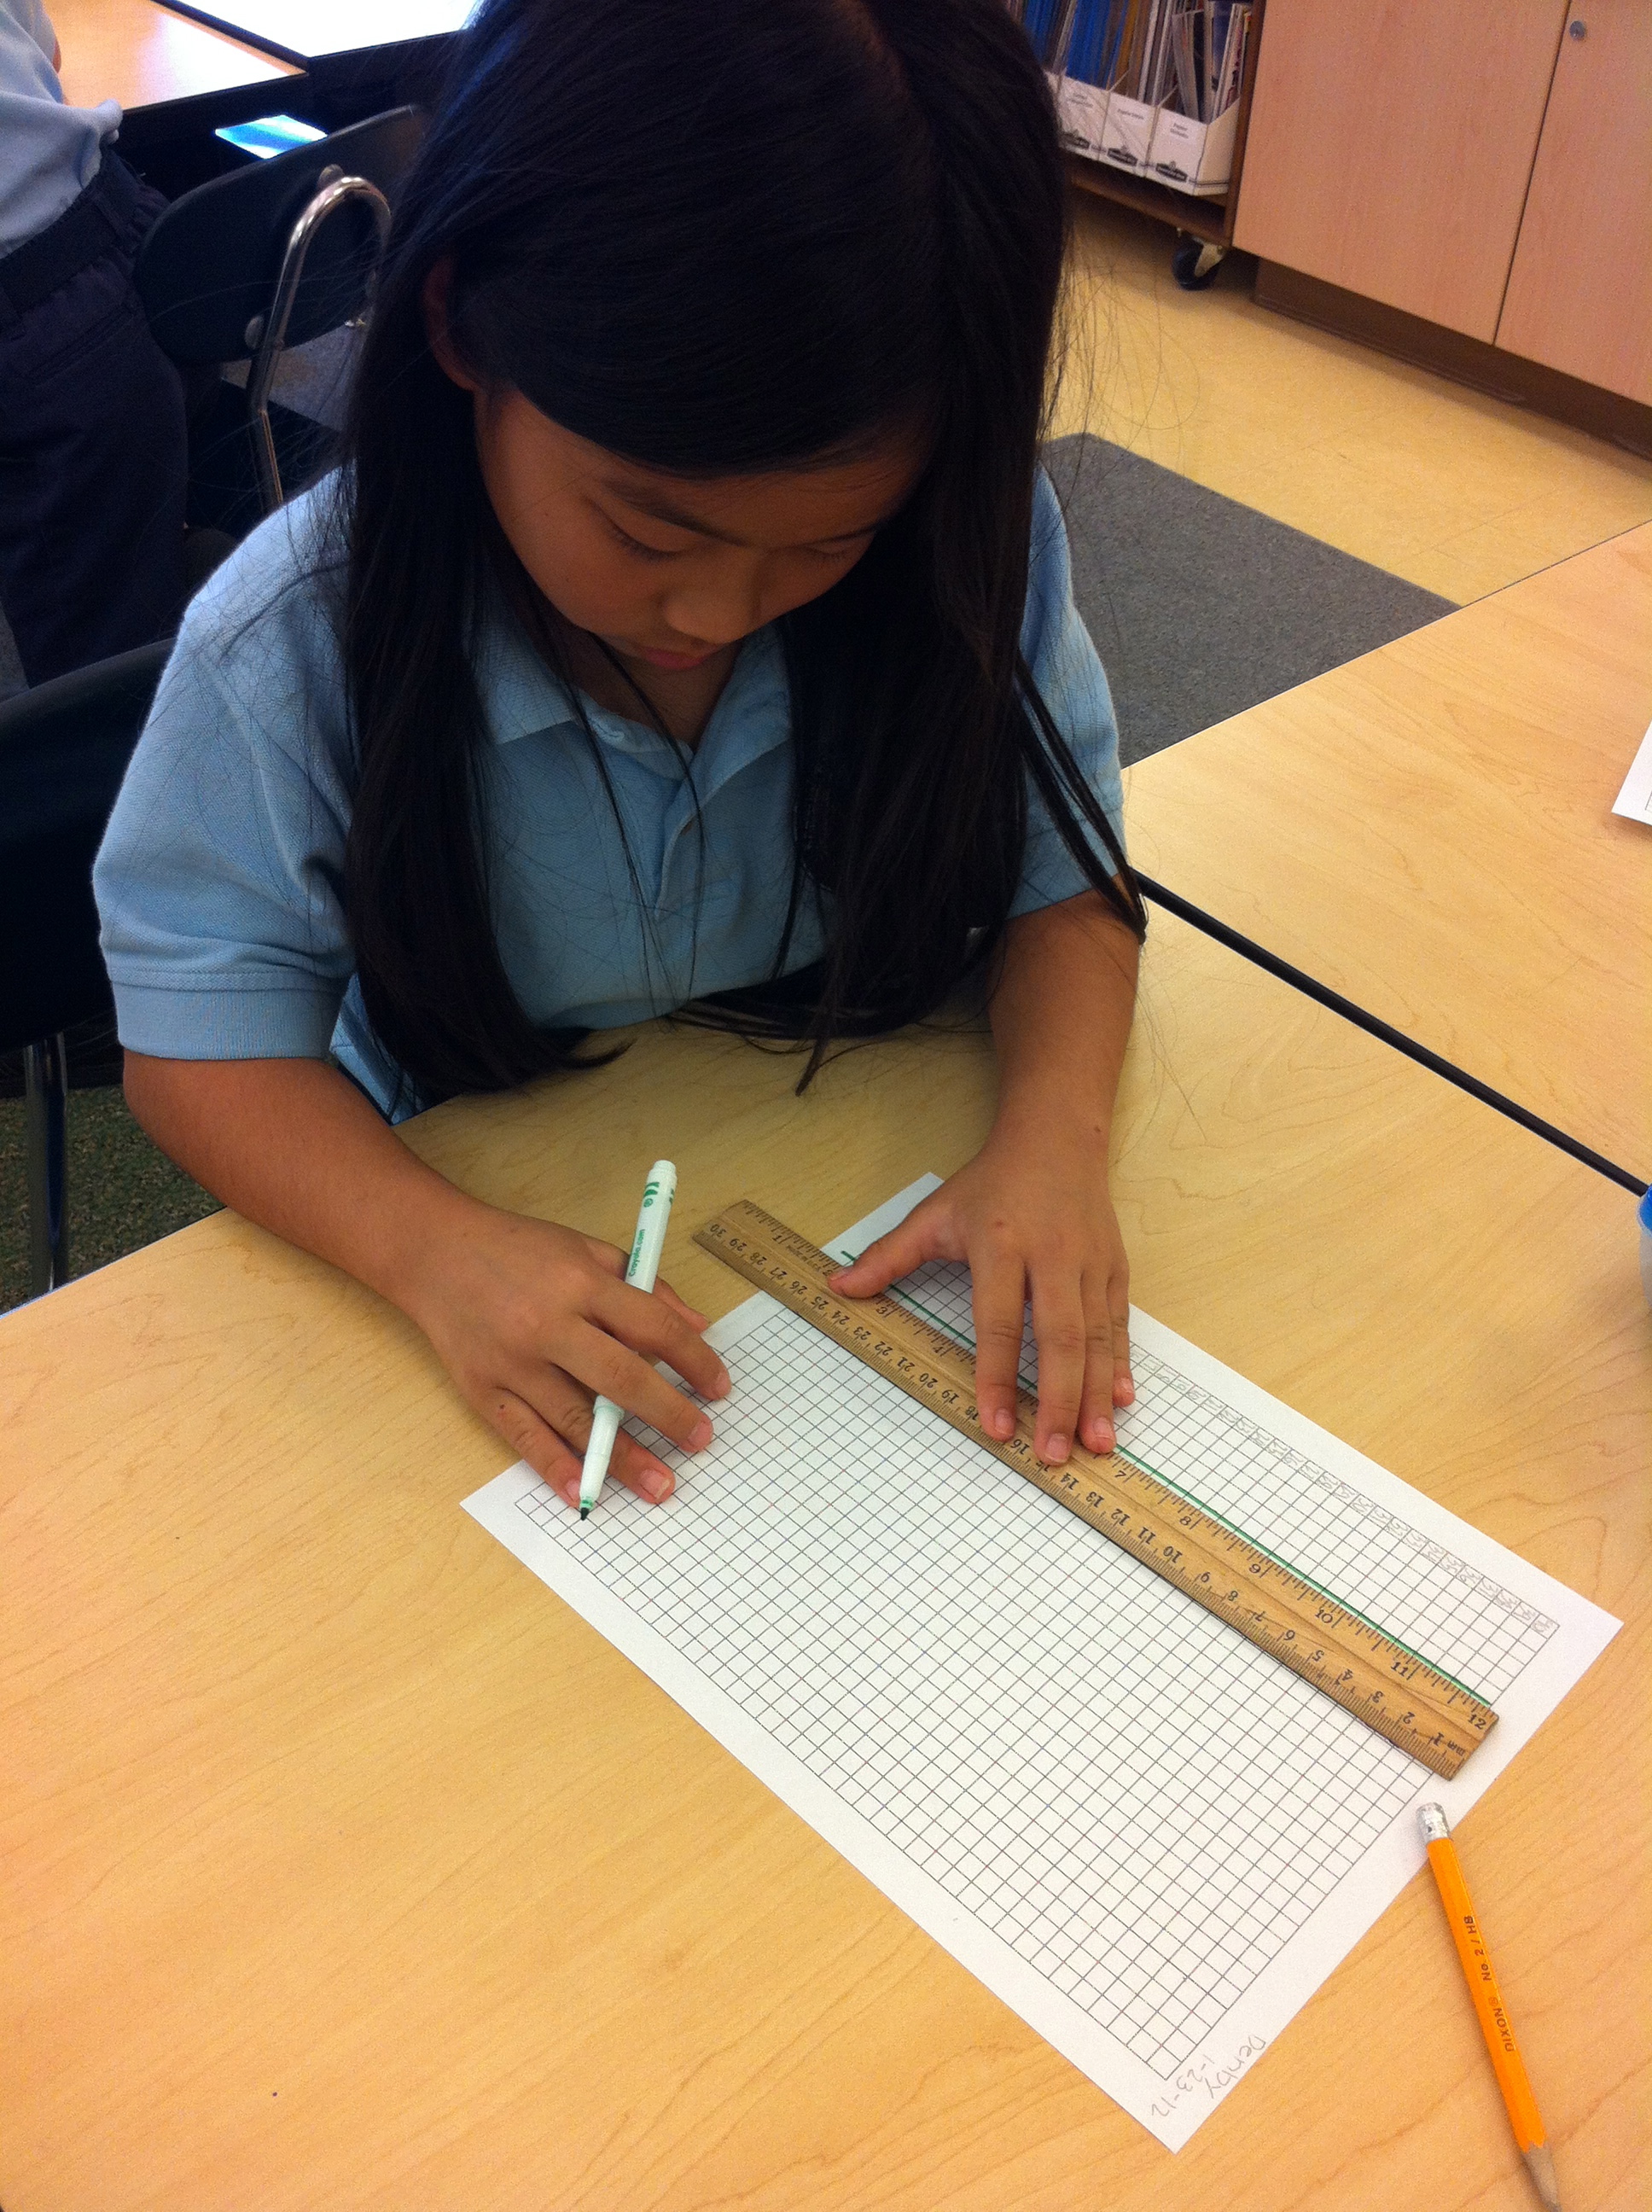
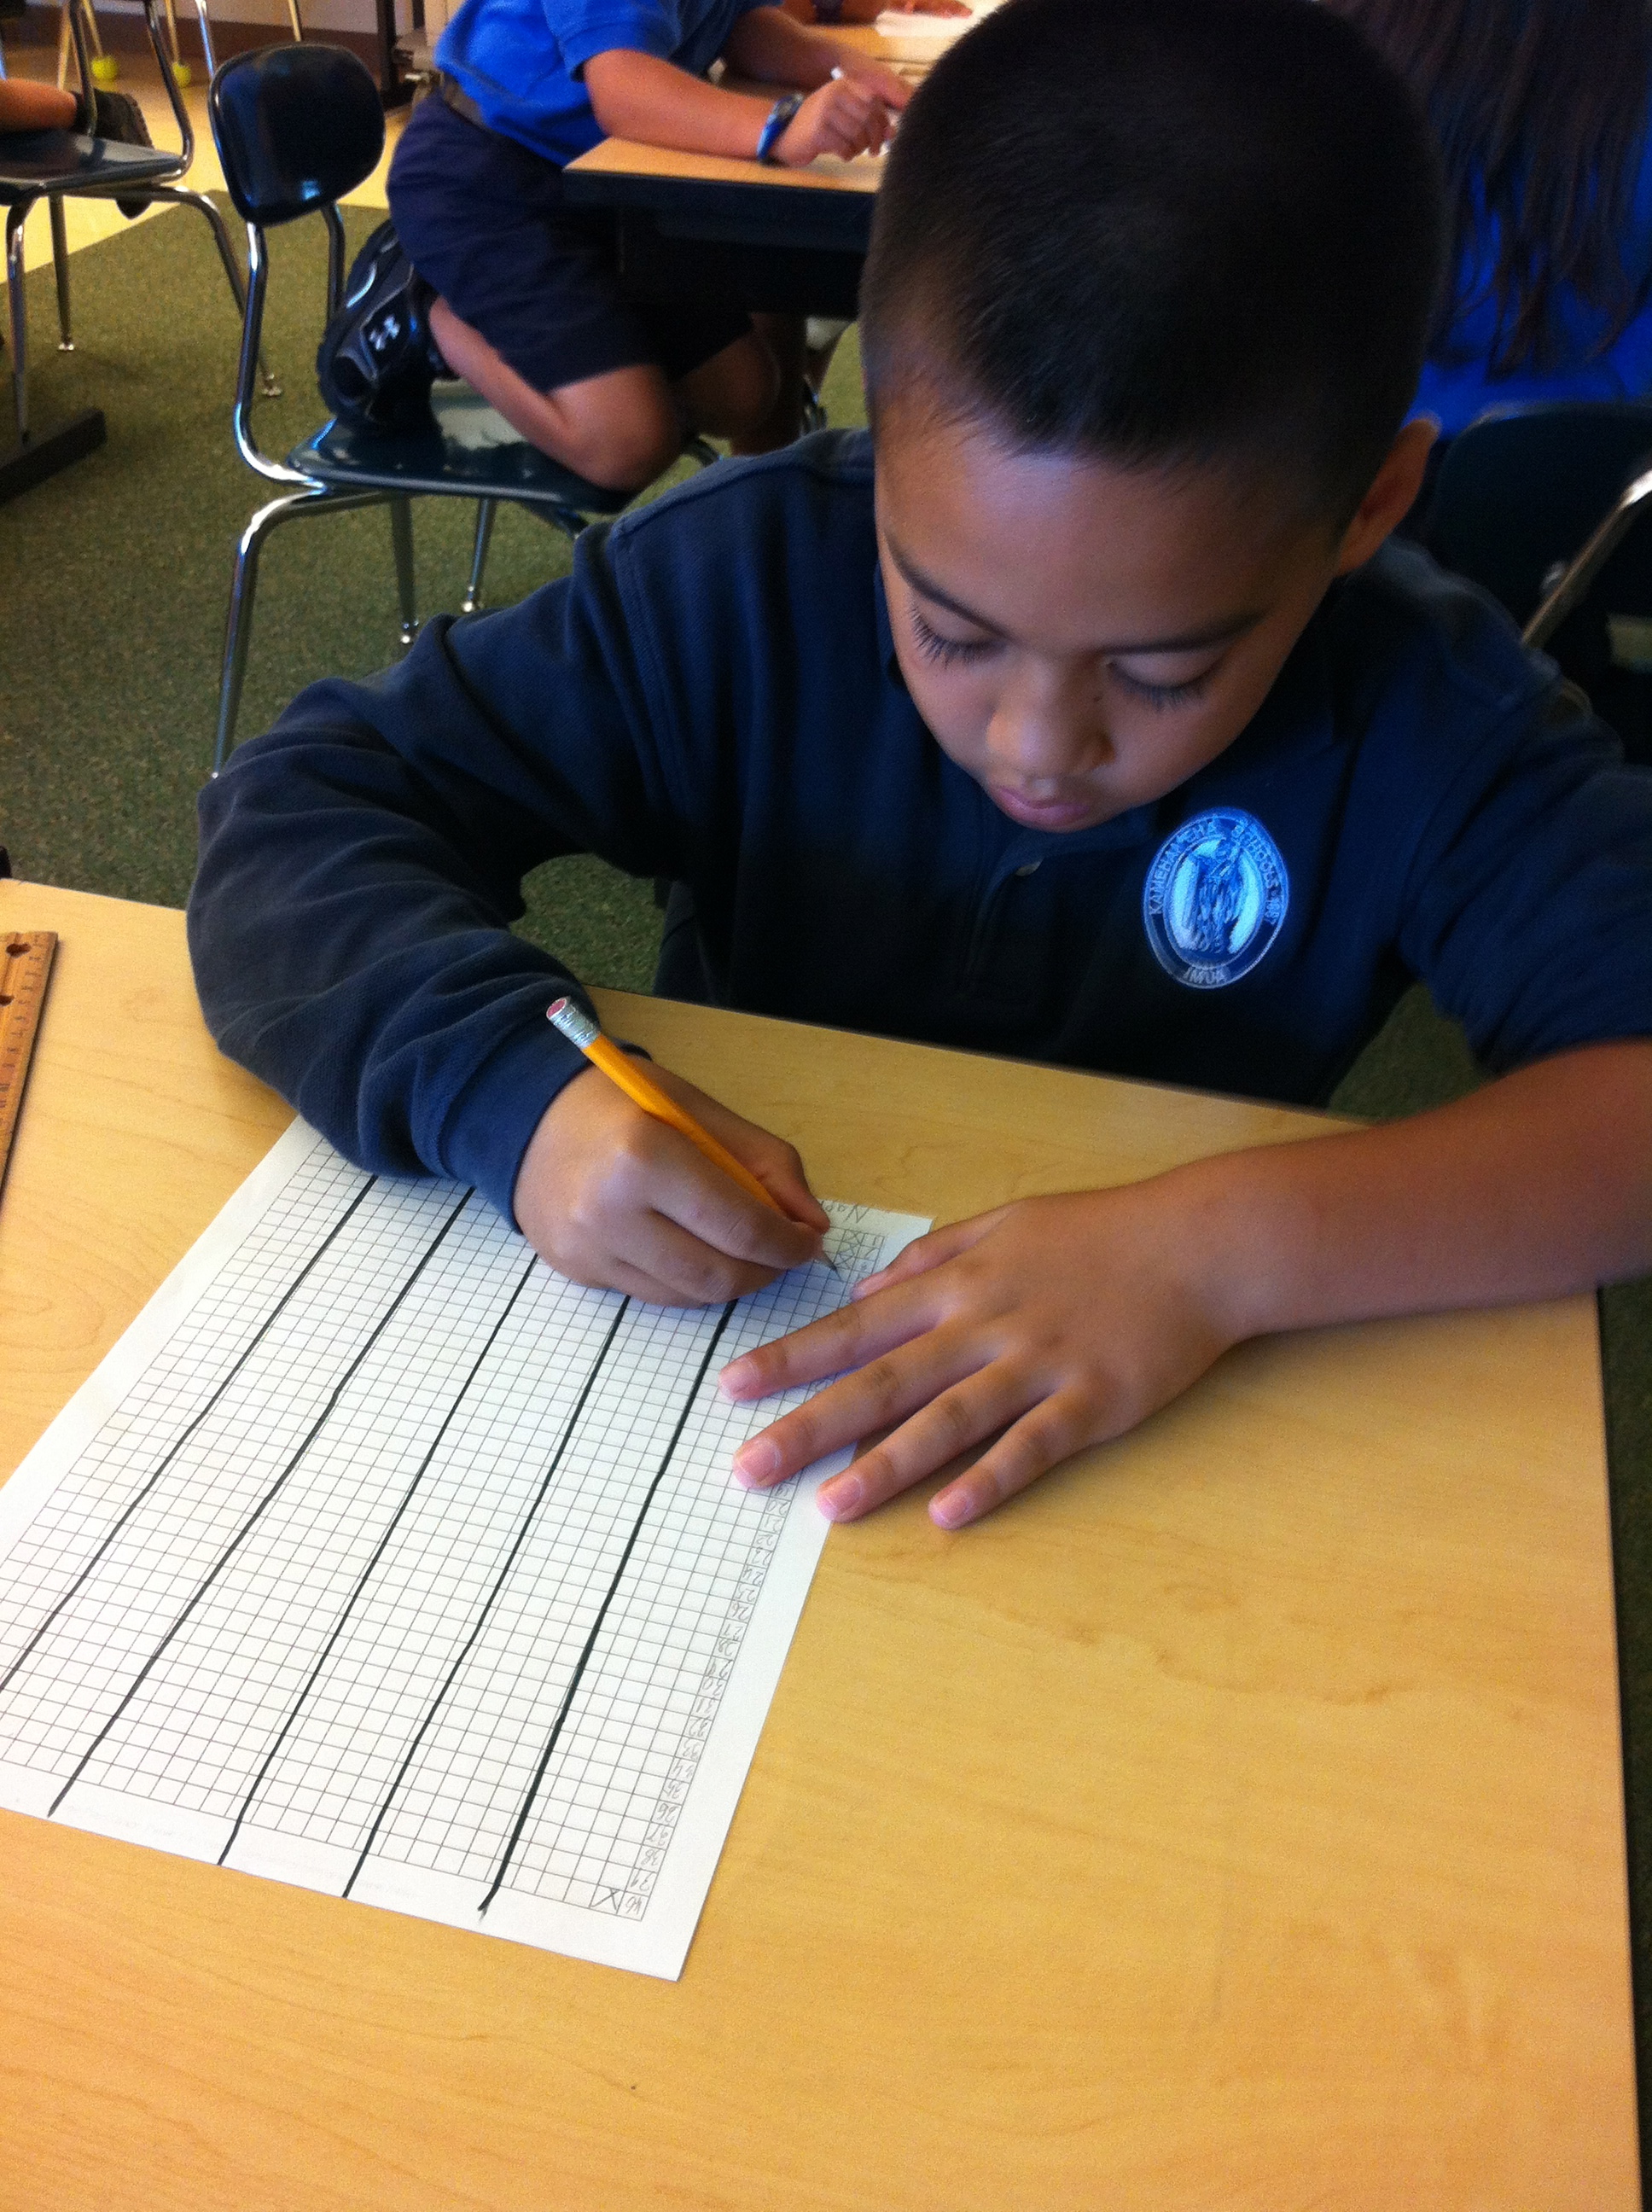
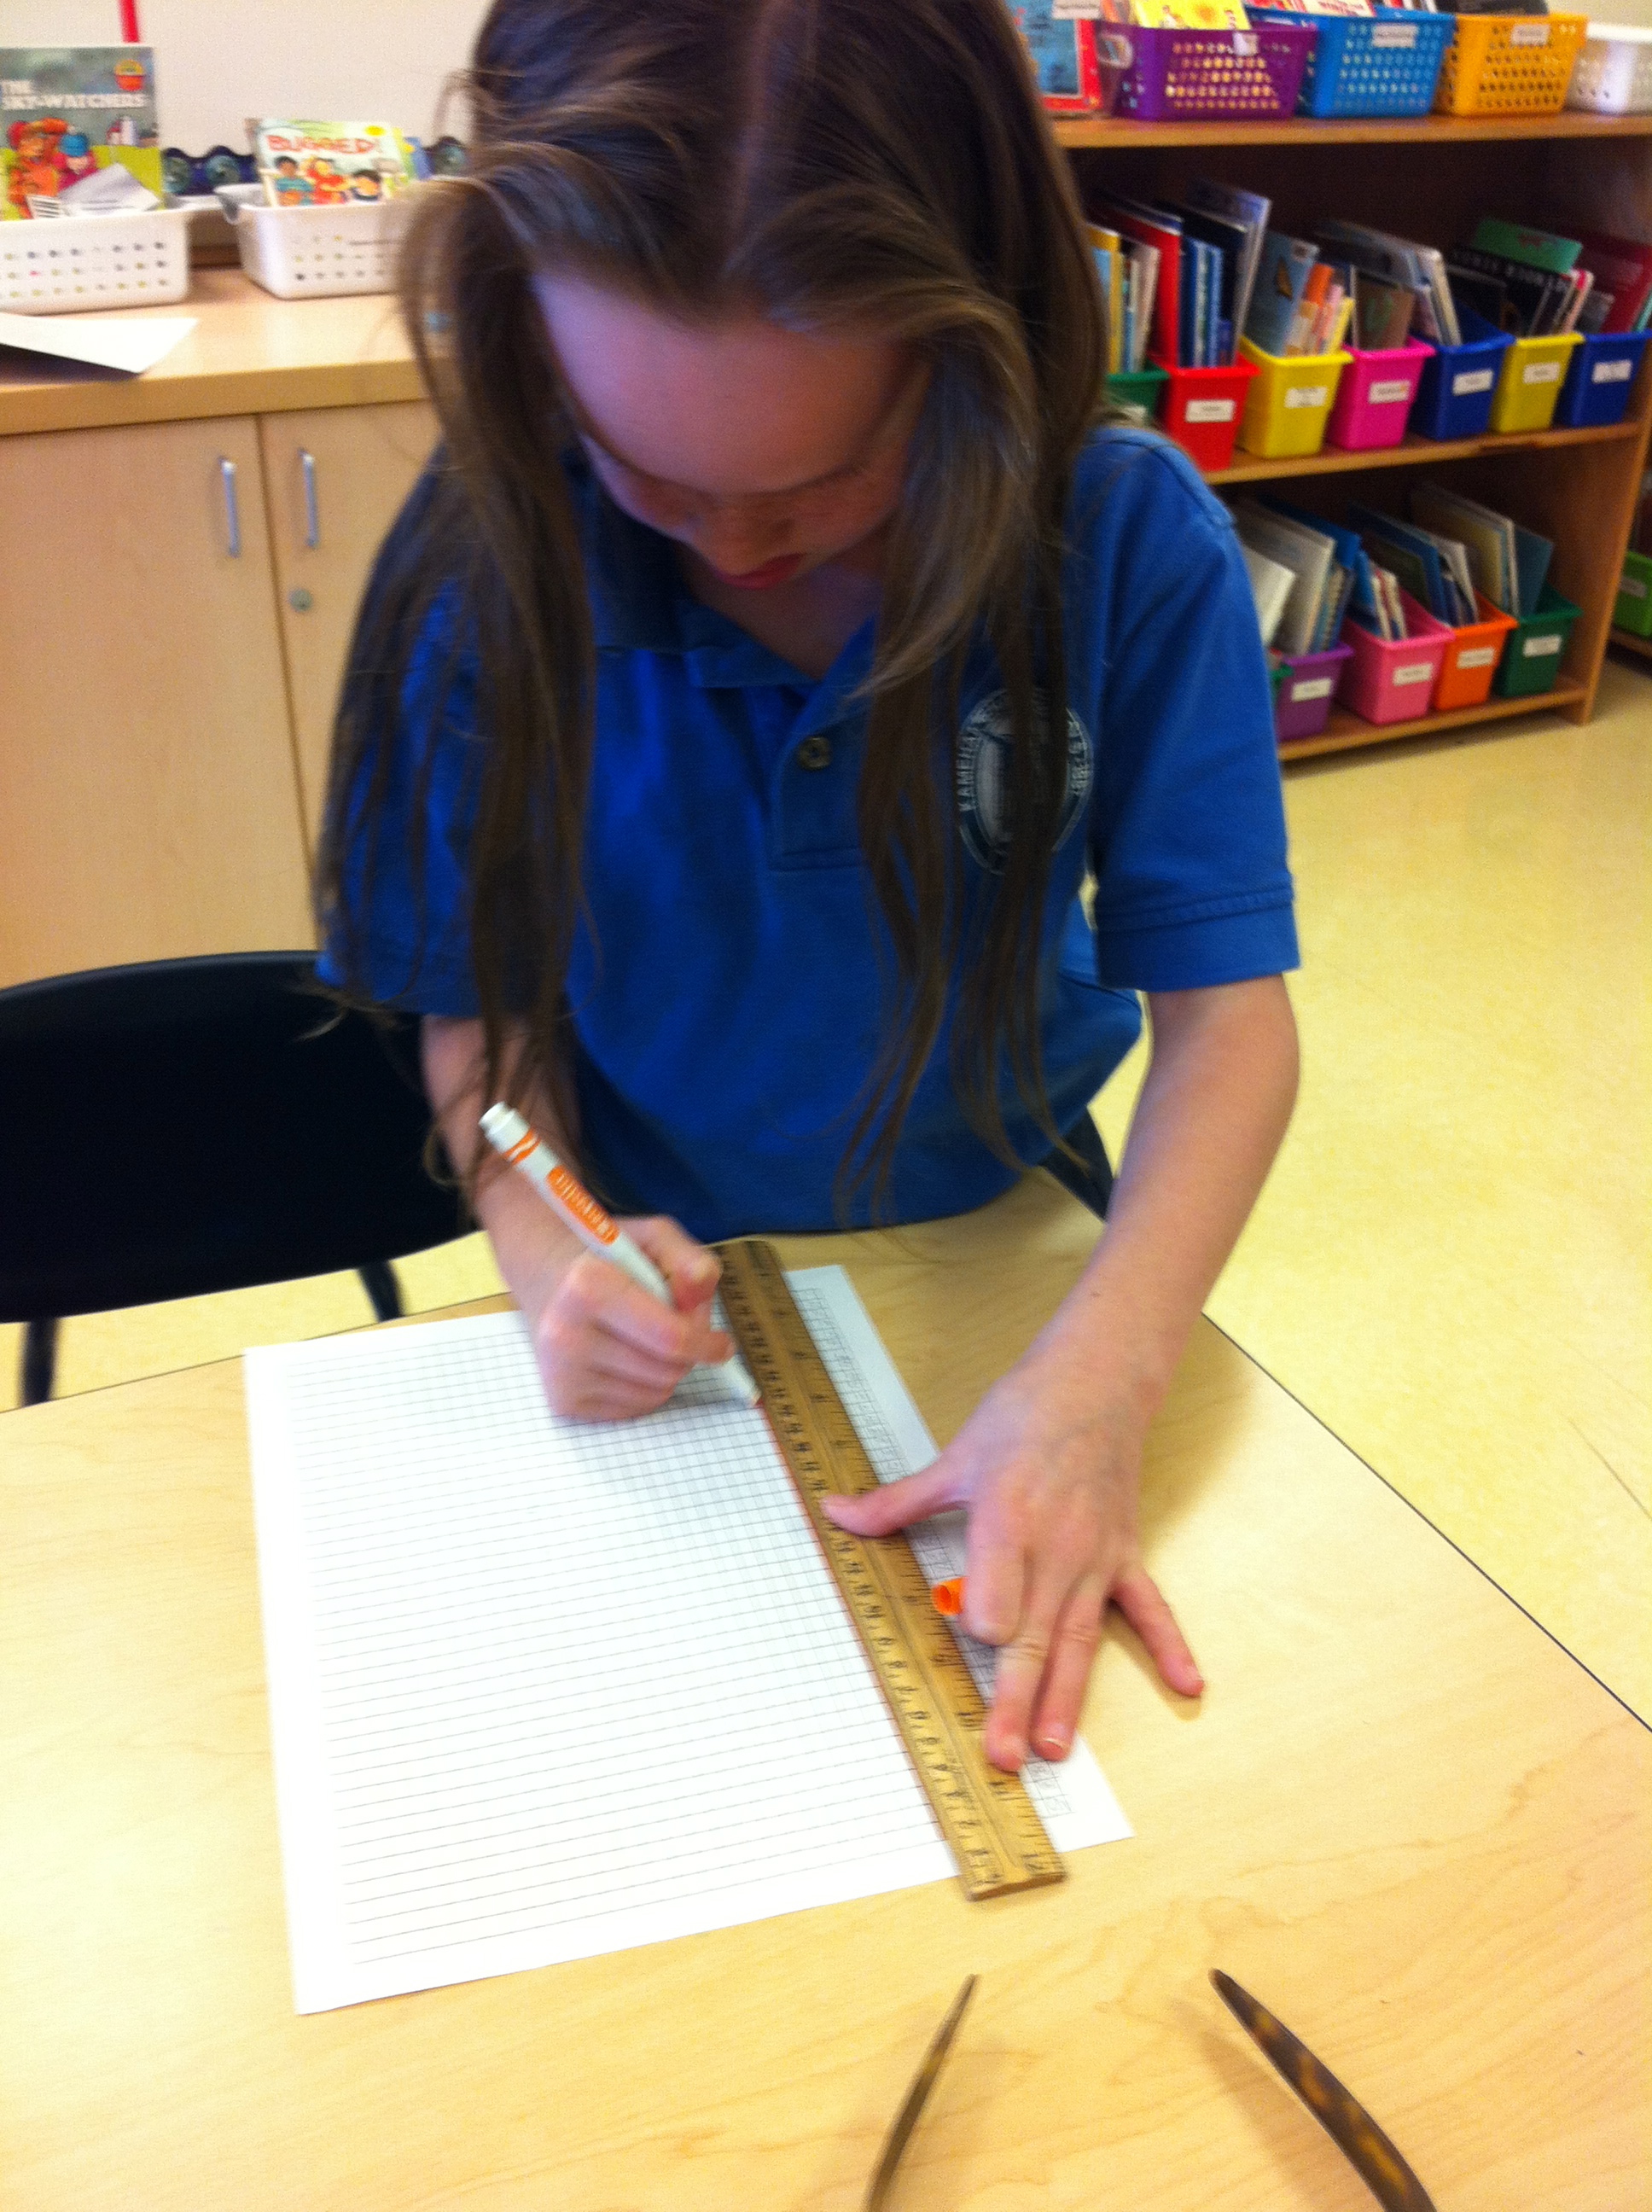
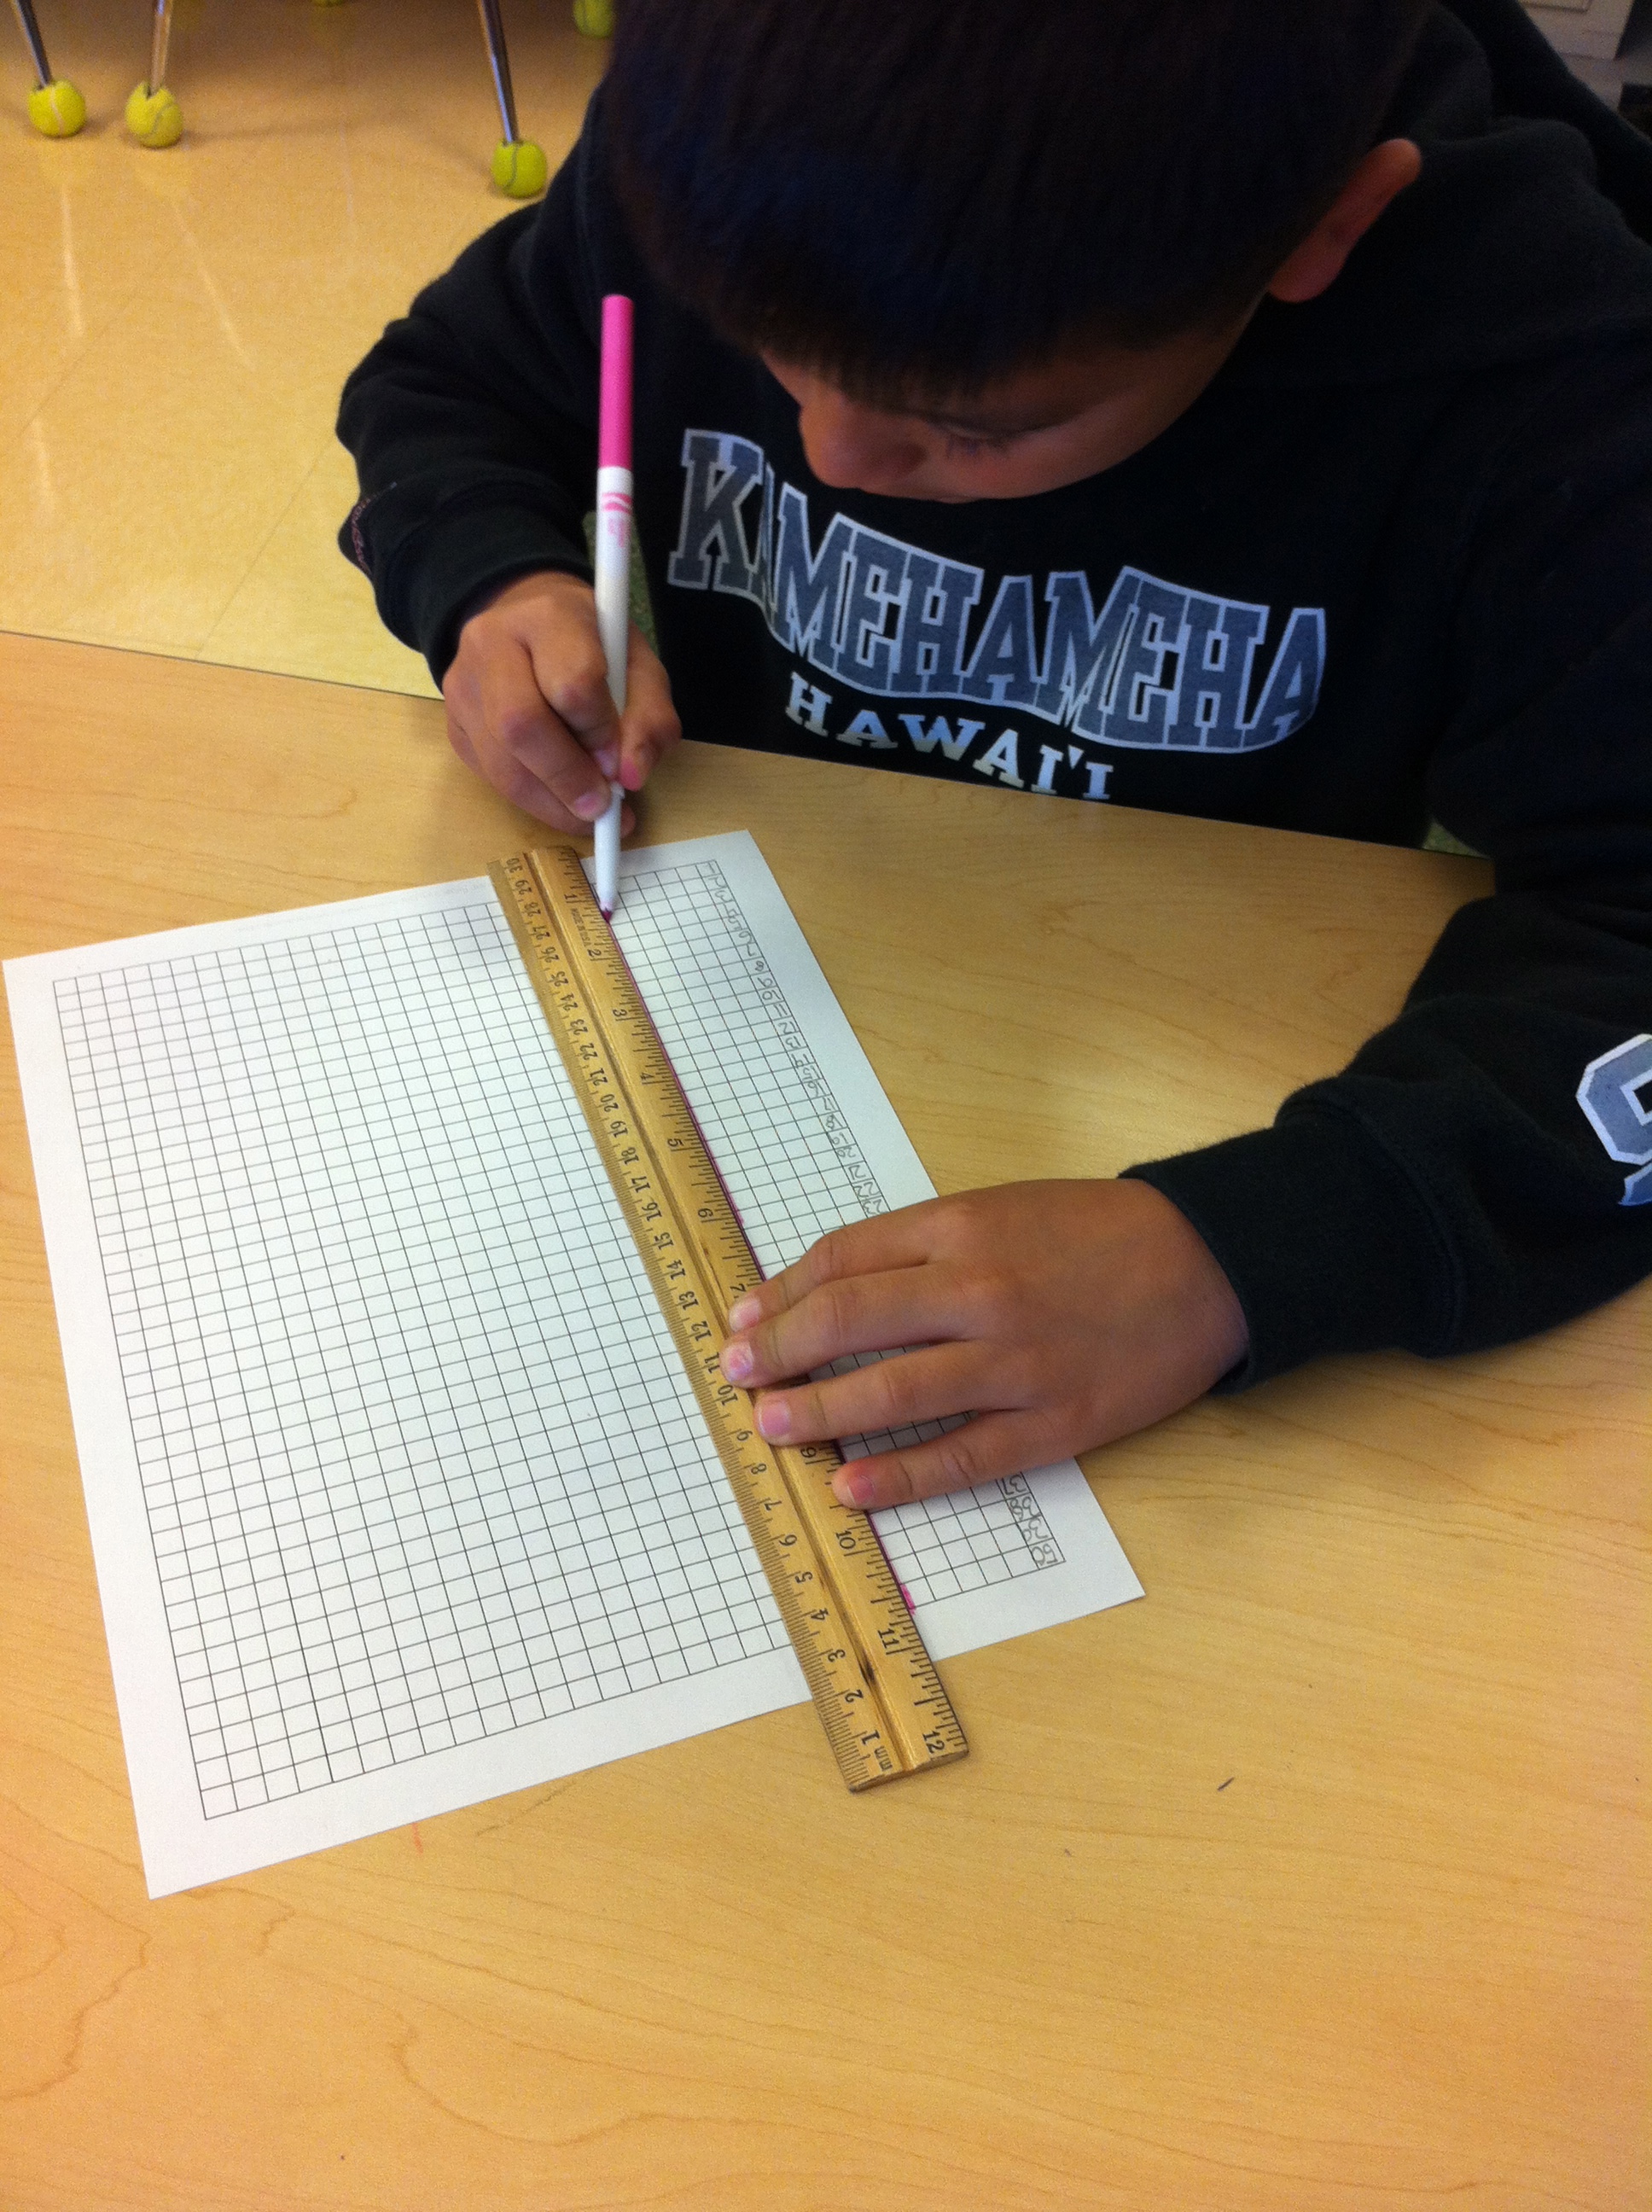
Yesterday, the students began making their own graphs of the trash that was collected. Using a ruler, pencils and color markers the students drew their columns for each item: napkins, paper towels, cartons, kleenex and others. Then x’d out the amount of each item i the columns. What a wonderful job they did for their first time doing a graph.
Next class we’ll use the graph to compare the items and continue to enhance their math skills in science.

One Response to 2G: Graphing Trash